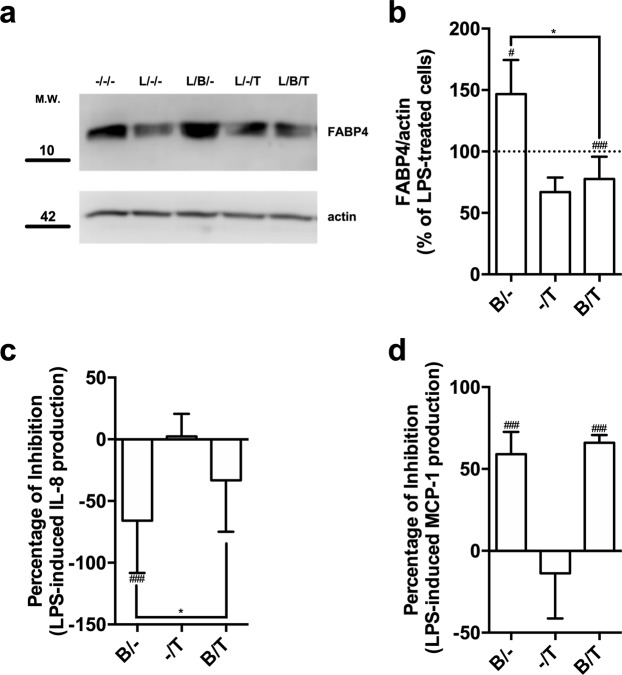
Figure 4.
Effect of pharmacological inhibition of PPARγ on the immuno-modulatory activity of bindarit. (a) Representative immunoblot showing the expression FABP4 in MM-6 cells left untreated (−/−) or treated with 100 ng/mL LPS (L) for 20 hours, in the absence (L/−) or presence of 300 μM bindarit (B) and 2 μM T0070907 (T), used alone or in combination (L/B− an L/B/T). Protein lysates were subjected to immunoblotting following 10% SDS-PAGE against the anti-FABP4 antibody. Actin was also probed with anti-actin antibody to confirm equal protein loading. Molecular weights (M.W.) of protein markers (in kDa) are shown on the left side. (b) Bar graph of the densitometric analysis of 5 independent experiments. The results were normalized with respect to the actin signal, and were reported as percentage of increase (±S.D.) with respect to the normalized value of the treatment with LPS. Significance is shown as P value calculated using a one-sample t-test. #P < 0.05 vs LPS (set to 100%). ###P < 0.001 vs LPS. *P < 0.05. Inhibition of the production of IL-8 (c) and MCP-1 (d) from LPS-stimulated monocytes by bindarit (B, 300 μM) and T0070907 (T, 5 μM), used alone (B/− and −/I) or in combination (B/I). After treatment, chemokine contents were analyzed in the supernatants by AlphaLISA and were expressed as percentage of inhibition of LPS-stimulated cells. Values are means ± S.D. of five independent experiments, each performed in duplicate. Significance is shown as P value calculated using an unpaired t-test. ###P < 0.001 vs LPS (set to 0%). *P < 0.05.

