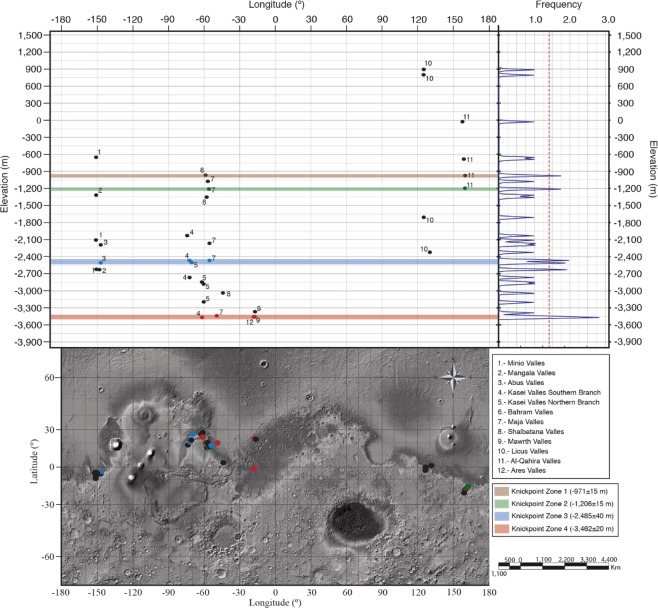
Figure 2.
Topography, distribution of base-level change knickpoints and elevation of knickpoint zones on Mars. The lower map shows the topography of Mars with superimposed possible base-level change knickpoints categorized by the knickpoint zone in which are included. The upper part of the figure comprises, on the right, the Kernel Density Estimate of base-level change knickpoints by elevation and, on the left, a graph displaying the distribution by elevation of the possible base-level change knickpoints against their longitude. Both graphs share the same elevation axis (Y-axis). In the upper-left graph each knickpoint is associated with a number indicating the channel system within is located. The upper-left graph and lower map share the same longitude axis (X-axis). The knickpoints contained within each knickpoint zones have been represented by a point with the same colour than the knickpoint zone. Knickpoints represented by the black colour are not contained within any knickpoint zone. Some of the 34 potential base-level change knickpoints are located too close to each other and thus overlap at this map scale (see Supplementary Table 1 for the complete list of knickpoints).

