Fig. 6.
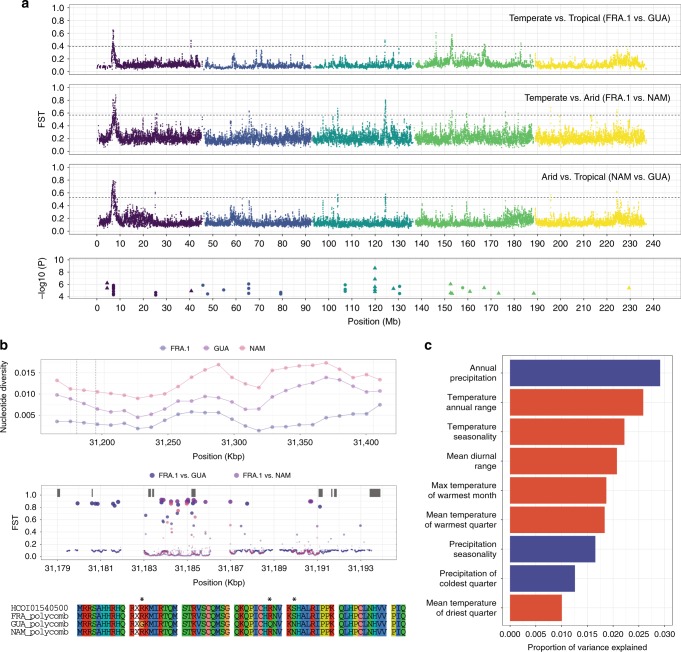
Genomic signal of climate adaptation. a Top three panels represent FST values plotted against genomic position (Mbp), coloured and ordered by chromosome name (from I in purple to V in yellow). Horizontal dashed line represents the 0.5% quantile. Bottom panel shows genomic positions of significant associations between annual precipitation (circle) and temperature annual range (triangle). In that case, −log10(P) refers to log-transformed P values estimated by the Latent Factor Mixed Model analysis. b A Polycomb group protein coding gene (Pc) underpins major differentiation signal across climatic conditions. Top panel shows nucleotide diversity estimates for 10-Kbp genomic windows spanning windows of chromosome III with high genetic differentiation between populations from arid, temperate and tropical areas. Dashed lines indicate the Pc ortholog boundaries. Within these boundaries, FST estimates along every base-pair of the gene sequence are represented below (circle size proportional to FST coefficient), with predicted exon model shown as grey rectangles. The bottom panel shows translated consensus sequences of exon 5 for populations of interest with asterisks marking mutations. c Proportion of genetic variance explained by climatic variables. Variants from eight isolates with no record of ivermectin resistance (AUS.2, FRA.1, GUA, IND, MOR, NAM, STO, ZAI) were analysed against a set of nine variables (from a total of 19, either precipitation- or temperature-associated coloured in blue and red respectively), selected to minimise correlation between variables. Annual precipitation (BIO12) and temperature annual range (BIO7) are main contributors of genetic variance

