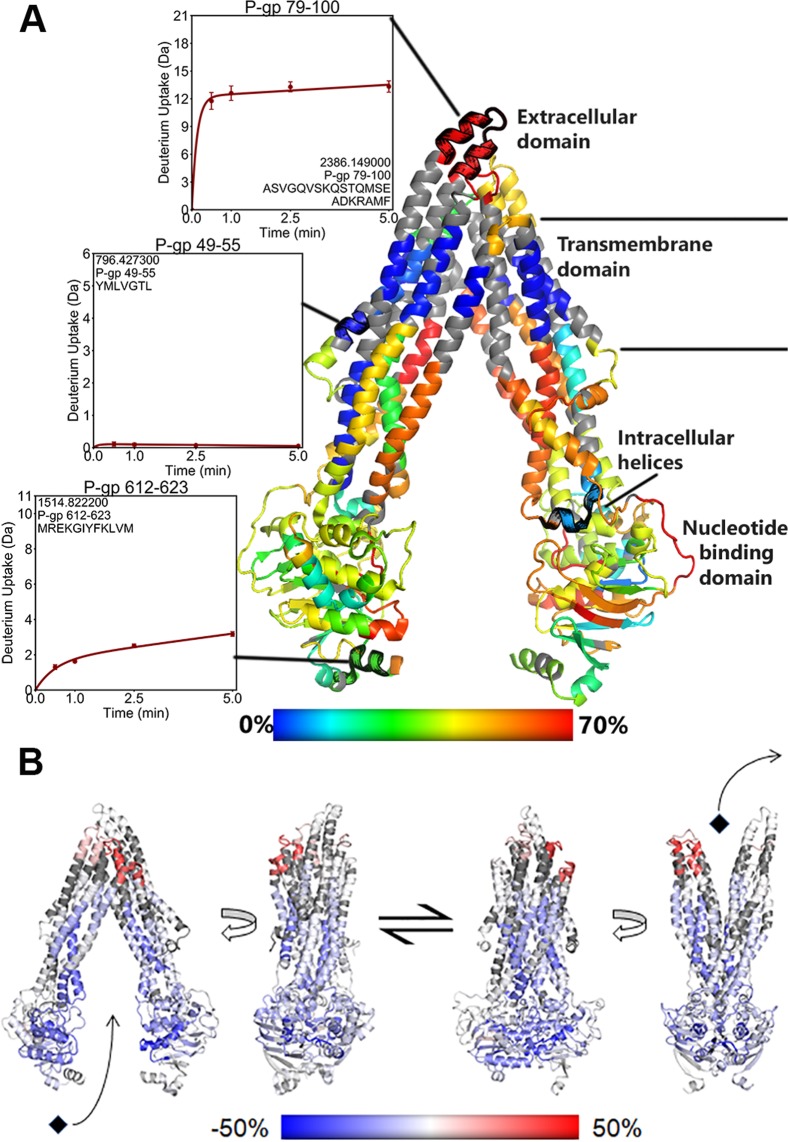
Figure 1.
(A) Domain organization of P-gp. HDX-MS data have been mapped on the inward-facing crystal structure of P-gp8. The model is colored on a rainbow scale from lowest (blue) to highest (red) by relative deuterium uptake of apo P-gp after 5 minutes of exchange. Solvent occlusion by the detergent micelle is indicated by low exchange along the transmembrane domain. (B) Diagram of the conformational transition between inward and outward-facing states. A homology model based on outward-facing MsbA was used to represent outward-facing P-gp11. Structures are colored by difference in relative uptake between inward and outward-facing P-gp after 5 minutes of exchange. Regions with decreased exchange in the outward-facing state appear blue, while regions with greater exchange are colored red.

