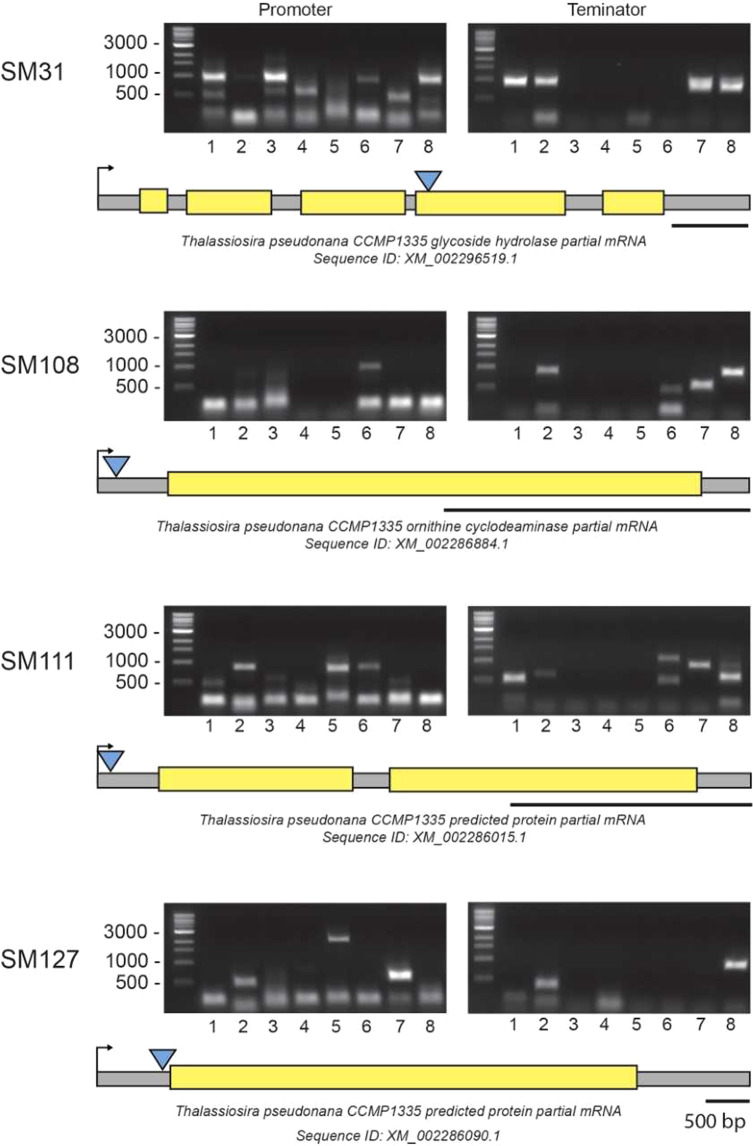
Figure 2.
Mapping the genomic insertion sites in those transformants less able to acclimate to low or high temperatures. TAIL-PCR was performed on genomic DNA extracted from the transformants SM31, −108, −111 and −127 using the degenerate primers in each reaction in combination with the construct-specific primers for either the promoter or terminator ends. The number under each lane indicates the degenerate primer used in that reaction (Fusion 1–8, Supplementary Fig. 2). The final PCR products were separated and visualized by gel electrophoresis as shown, with selected individual products then purified and sequenced. Shown under each gel picture is the predicted gene model as identified by TAIL-PCR, with the yellow regions representing exons and the gray regions representing the non-coding sequences including introns and the 5′- and 3′ untranslated regions. The transcriptional start site for each gene is shown by the right-pointing arrow, with the genomic insertion site as mapped being indicated by the blue triangle. Underneath each gene map is shown the closest match in GenBank to the predicted S. marinoi protein along with the corresponding sequence identification number.

