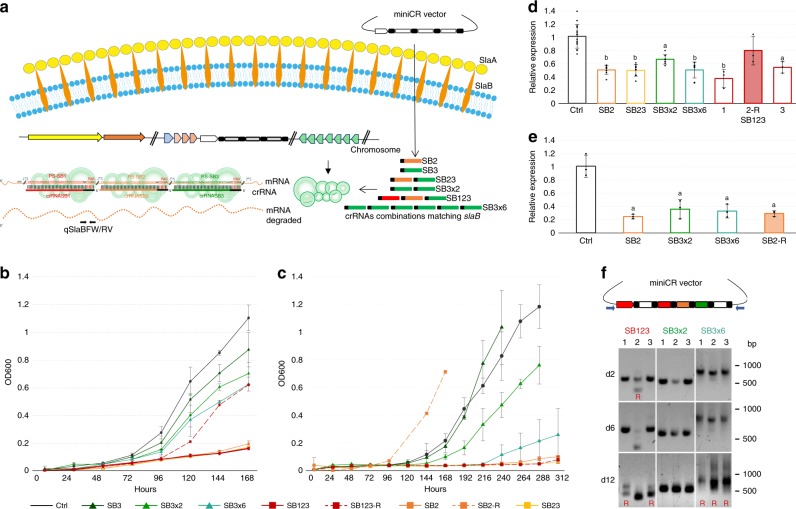
Fig. 1.
Silencing of slaB in S. solfataricus. a Schematic representation of the type III silencing pathway used for slaB knockdown. CrRNA assortments expressed from different miniCRISPRs in trans target the slaB mRNA at three possible positions (i.e., protospacer PS1, 2 or 3), each carrying a 3′ protospacer adjacent sequence (PAS). Protospacer positions (measured from start codon) and RT-qPCR—primer binding site are indicated (qSlaBFW and qSlaBRV). b Optical density increase of pDEST-SB-silenced cultures and pDEST-Ctrl control cultures (without targeting spacer). SB123-R represents a reverted (R) culture, which has lost the targeting spacer (cf. Fig. 1d and f). Dark gray (circle): control; dark green (triangle): SB3; green (triangle): SB3×2; petrol (triangle): SB3×6; red dash (rectangle): SB123 replicates; red dashed (rectangle) SB123-R; orange (rectangle): SB2; yellow (rectangle): SB23. Error bars, mean ± SD (n = 3, i.e., three different plaques picked and inoculated into liquid medium). c Optical density increase of pIZ-SB-silenced primary cultures and pIZ-Ctrl control cultures. Dashed orange line (SB2-R) represents a reverted (R) miniCR-SB2 culture, which arose by mutation of the targeting spacer upon culture transfer (cf. Fig. 1e). Color code/line markers and SD are defined as in b. d RT-qPCR on total RNA extracts of pDEST-SB-silenced cultures harvested at OD600 = 0.1. SlaB mRNA was quantified by qSlaBFW and qSlaBRV primers relative to the reference gene SSOP1_3283 (glyceraldehyde-3-phosphate dehydrogenase); Filled bars = reverted culture (R) (cf. 1c); Lower case letters indicate significant differences to Ctrl (two-tailed t test, n ≥ 3, p ≤ 0.007). Error bars, mean ± SD (at least three biol. and tech. replicates). e RT-qPCR on total RNA extracts of pIZ-SB-silenced cultures at OD600 = 0.1. SlaB mRNA was quantified by qSlaBFW and qSlaBRV primers relative to the reference gene SSOP1_3283 (gapN-3); Filled bars = reverted culture (R); Lower case letters indicate significant differences to Ctrl (two-tailed t test, n = 3, p ≤ 0.0137); Error bars, mean ± SD (three biol. replicates). f PCR products amplified by virus vector-backbone primers (blue) of pDEST–SB123, SB3×2, and SB3×6 transformants sampled at 2, 6, and 12 days after plaque inoculation, respectively. Three biol. replicates shown (1,2,3). Double bands and smears indicate loss of targeting spacers. Positions of DNA ladder are indicated (bp). Source data are provided70

