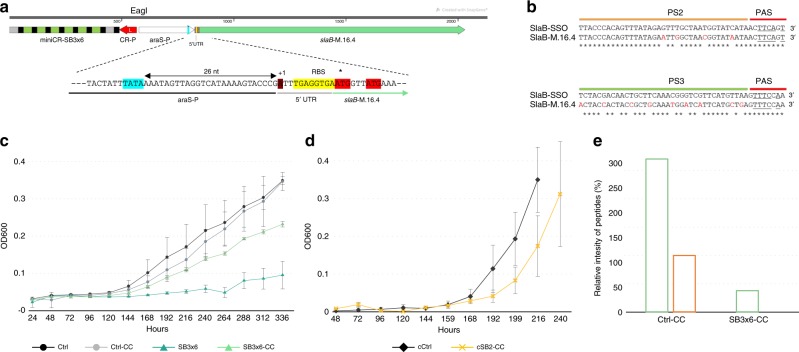
Fig. 2.
Complementation of slaB. a Fusion product of SB3×6 miniCR (CRISPR-promoter, red) and the complementation cassette: arabinose-inducible promoter: araS-P (TATA box, blue), 5′-UTR of slaB S. islandicus M.16.4 (M164_1762) including the putative TSS (dark red), a native ribosomal binding site (RBS, yellow) and two potential translation starts (ATG, red). b Nucleotide sequence alignment of S. solfataricus protospacer 2 and 3 (slaB-SSO) and respective regions on S. islandicus M.16.4 slaB gene (slaB-M.16.4). Asterisks: matching nucleotide; red: mismatches; underlined: PAS-5′ crRNA handle complementarity. c Optical density increase (arabinose supplemented medium) of pIZ-plasmid primary cultures carrying silencing constructs, control constructs (Ctrl) and complementation constructs (-CC), respectively. Dark gray (circle): control; light gray (circle): control-CC; petrol (triangle): SB3×6; light petrol (triangle): SB3×6-CC. Error bars, mean ± SD (three biol. replicates). d Optical density increase (arabinose supplemented medium) of pIZ-plasmid cultures recovered from single colonies (prefix “c”) control and complementation constructs. Dark gray (rectangle): control; yellow (x): SB2-CC. Error bars, mean ± SD (three biol. replicates). e Relative intensity values (MaxQuant) of SlaB peptides of S. solfataricus and S. islandicus detected by mass spectrometry in Ctrl-CC and SB3×6-CC complemented cultures, respectively. Bars in the graph represent the samples in the following order from left to right (in the different cultures): S. islandicus SlaB (light green), S. solfataricus SlaB (brown). Y-axis shows intensity values normalized to Ctrl-CC SlaB-SSO in percent. Source data are provided70

