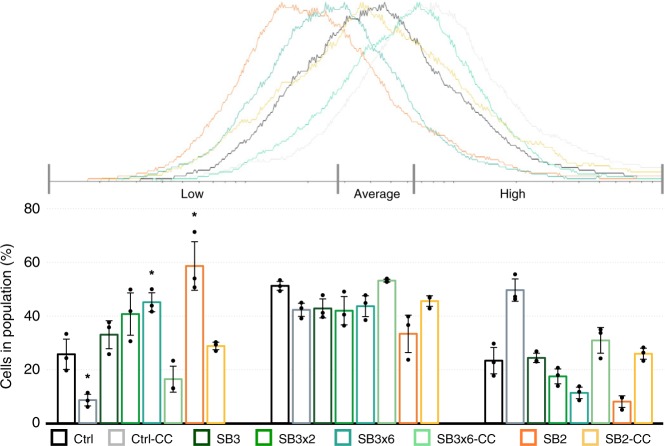
Fig. 4.
Surface glycosylation in silenced and control pIZ-plasmid cultures. FC-Histogram (fluorescent flow cytometry, created with Flowing Software 2.5.1, 3 biol. repl, n = 10,000 per replicate) of lectin stained (WGA-Alexa488) cultures harvested at OD600 = 0.1. Bar chart represents percent of cells in population showing low, average or high fluorescence (normalized to cell size). Sections were defined according to Ctrl histograms. Bars in the graph represent the samples in the following order from left to right (in every section): Control (dark gray); control-CC (light gray); SB3, (dark green); SB3×2 (green); SB3×6 (petrol); SB3×6-CC (light petrol); SB2 (orange); SB2-CC (yellow). Error bars, mean ± SD (three biol. repl.). Asterisks indicate significant differences to Ctrl (two-tailed t test, n = 3, p ≤ 0.037). Source data are provided70

