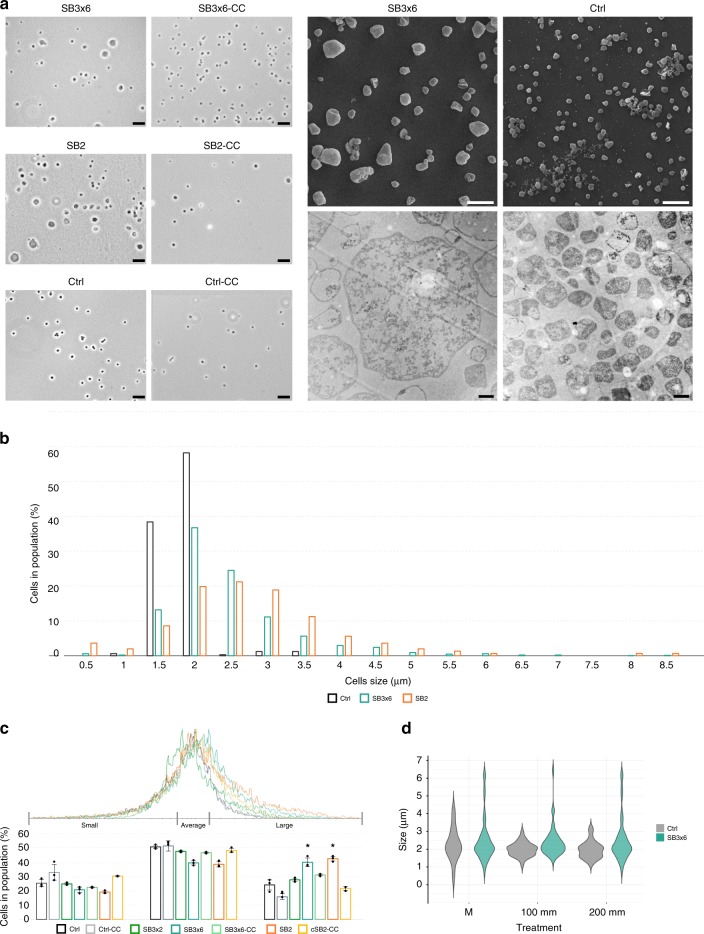
Fig. 5.
Cell size distribution in silenced and control pIZ-plasmid cultures. a Left: phase contrast micrographs of Ctrl control, SB3×6 and SB2 slaB-silenced (left) and complemented cultures (-CC) (right). Scale bar: 10 µm. Right upper panel: scanning electron micrographs (gold coated) of slaB-silenced SB3×6 and Ctrl; scale bar: 5 µm (magnification × 2700). Right lower panel: Transmission Electron micrographs (magnification: × 6000) of thin sections (contrasted with Uranyl acetate 2%, and Lead citrate 2%) of slaB-silenced SB3×6 (left) and control Ctrl cultures (right); scale bar: 1 µm. b Cell size distribution of Ctrl, SB3×6, and SB2 cultures (OD600 = 0.1). Bars in the graph represent the samples in the following order from left to right: Control (dark gray); SB3×6 (petrol); SB2 (orange). Cell sizes were measured using MicrobeJ software on phase contrast micrographs (n > 300, different biol. replicates). c FSC-histogram (Forward scatter, flow cytometry, created with Flowing Software 2.5.1) of silenced and control cultures sampled at OD600 = 0.1 (n = 10,000 per biol. replicate). Bar chart represents percentage of cells in population exhibiting “small”, “average” and “large” size (size sections defined according to Ctrl histograms). Bars in the graph represent the samples in the following order from left to right (in every section): Control (dark gray); control-CC (light gray); SB3×2 (green); SB3×6 (petrol); SB3×6-CC (light petrol); SB2 (orange); SB2-CC (yellow). Error bars, mean ± SD (three biol. replicates). Asterisks indicate significant differences to Ctrl (two-tailed t test, n = 3, p ≤ 0.009) d Salt-stress experiment. Violin plot depicts decrease and increase of abundances of specific cell sizes of untreated (M) pIZ-plasmid SB3×6 and Ctrl cultures (n = 50 cells per replicate and condition), and upon 100 mm and 200 mm salt treatment (treatment upon salt addition = 45 min, 77 °C, agitating), respectively. Plots represent the samples in the following order from left to right (in each treatment): Control (gray); SB3×6 (petrol). Cell size differences were measured as in b). Source data are provided70

