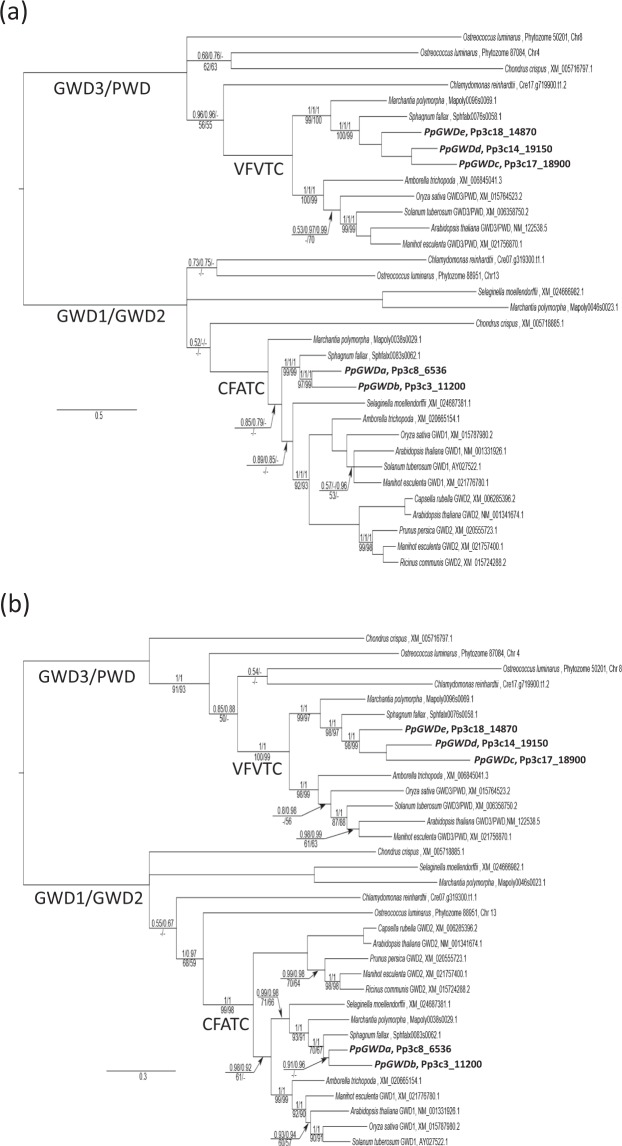
Figure 2.
Phylogeny of GWD sequences from various plant species. (a) 50% majority rule consensus tree from partitioned MrBayes analysis of the full DNA data set of Archaeplastid GWD/PWD sequences, showing phylogenetic placement of determined P. patens (bold) paralogs. The three numbers listed above branches are Bayesian posterior probabilities (PP) for the full, partitioned analysis, PP for a partitioned analysis with a region of uncertain homology excluded, and PP for the recoded RY analysis. Numbers under each branch are RAxML likelihood bootstrap support (BS) for the full, partitioned analysis and BS for a full, partitioned analysis with a region of uncertain homology excluded. Dashes indicate support for a branch <50%, or where the branch was not present in a particular analysis. Un-numbered branches received maximal support in all analyses. The scale bar is in substitutions per site. (b) 50% majority rule consensus tree from partitioned MrBayes analysis of the full AA data set of Archaeplastid GWD/PWD sequences, showing phylogenetic placement of determined P. patens (bold) paralogs. The two numbers listed above branches are Bayesian posterior probabilities (PP) for the full analysis, and PP for analysis with a region of uncertain homology excluded. Numbers under each branch are RAxML likelihood bootstrap support (BS) for the full analysis and BS for analysis with a region of uncertain homology excluded. Dashes indicate support for a branch <50%, or where the branch was not present in a particular analysis. Unnumbered branches received maximal support in all analyses. The scale bar is in substitutions per site. In (a,b) the branches subtending two land plant clades characterized by specific motifs are labelled with the corresponding amino acid sequence (VFVTC and CFATC). Sequences are identified either by Phytozome AGI codes or NCBI accession numbers.

