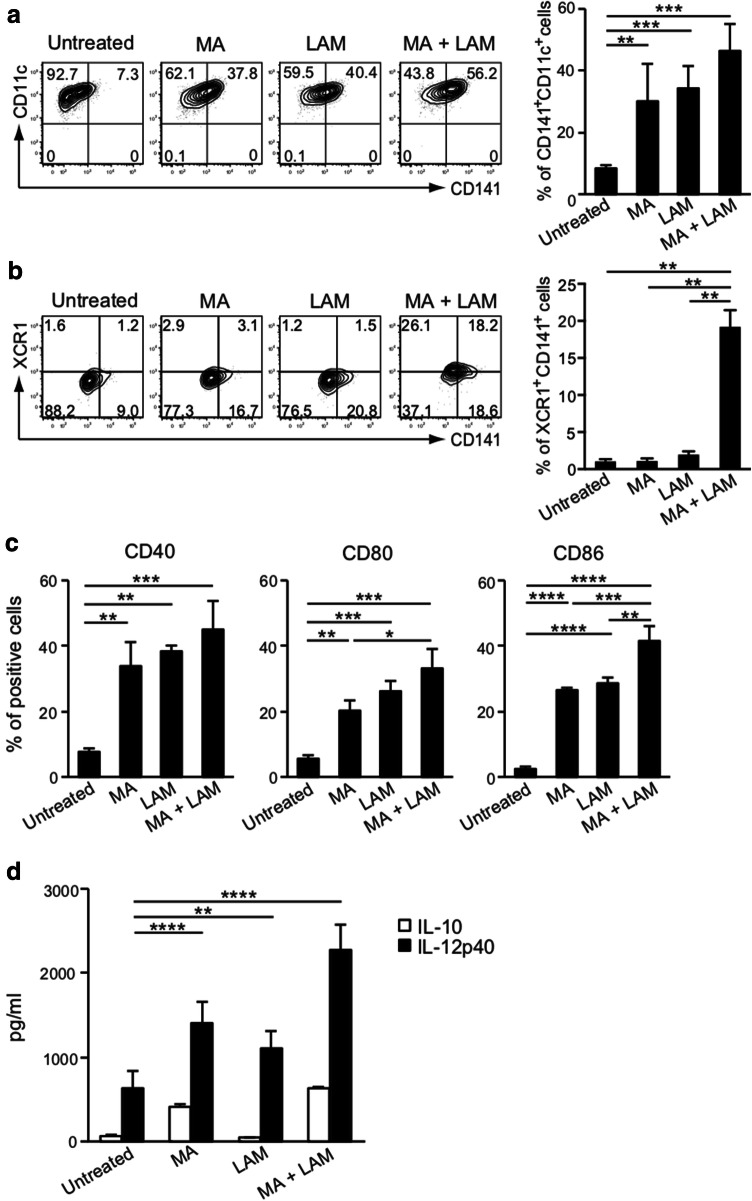
Fig. 4.
Effect of MA and LAM treatment on MDDCs. a Percentage of CD141+ CD11c+ cells among CD1a+ viable cells stimulated with MA and/or LAM from Aoyama B isolates was measured by flow cytometry. Data are shown as the mean ± SD of n = 3 samples per measurement. b The percentage of XCR1+CD141+ cells stimulated with MA and/or LAM from Aoyama B isolates was measured. Data are shown as the mean ± SD of n = 4 samples per measurement. c Expression of co-stimulatory molecules on MDDCs stimulated with MA and/or LAM from Aoyama B isolates. Data are shown as the mean ± SD of n = 3 samples per measurement. d IL-10 and IL-12p40 production of MDDCs stimulated with MA and/or LAM from Aoyama B isolate in supernatant. Data are shown as the mean ± SD of n = 4 samples per measurement. *p < 0.05, **p < 0.01, ***p < 0.001, ****p < 0.0001; one-way ANOVA followed by Bonferroni post-tests

