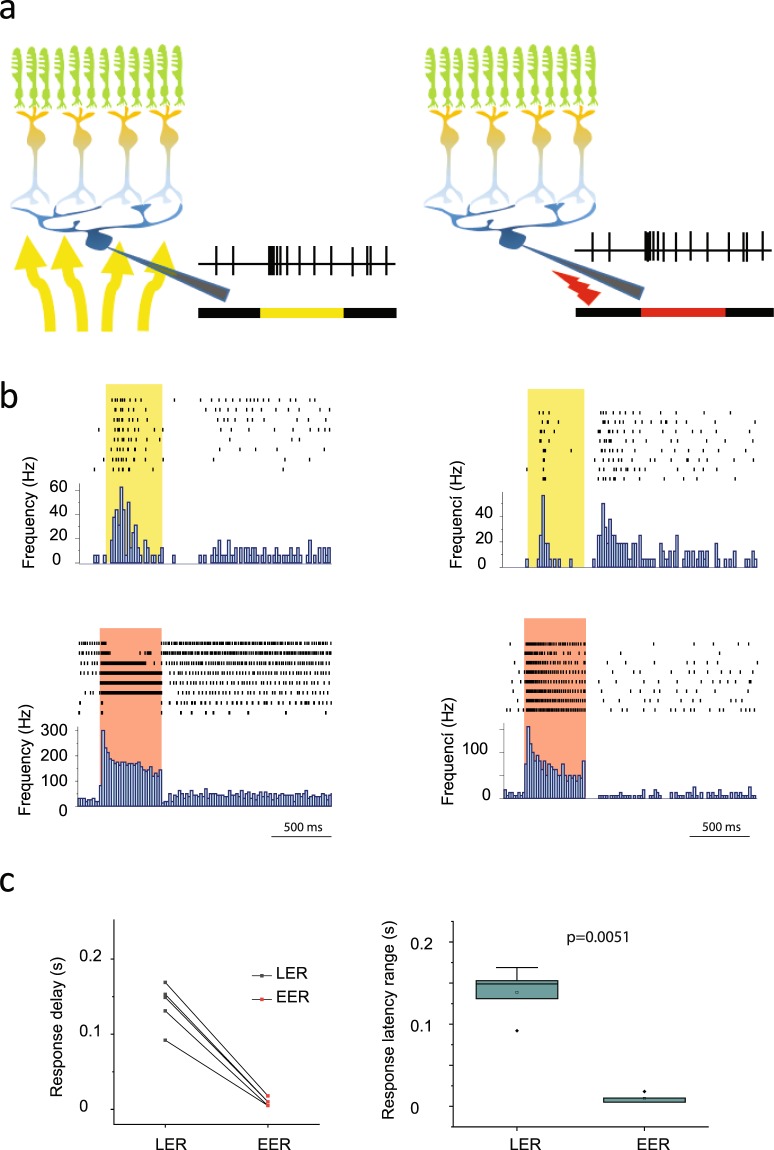
Figure 4.
The RGC Response Delay Range Considerably Decreases when Upstream Retinal Circuits are Bypassed. (a) Schematic drawings depict the two recording paradigms; classical loose-patch extracellular recording with a glass pipette (left) upon light stimulation (yellow arrows and yellow trace) and recordings following an electrical stimulation with a current pulse (red lightning sign and red trace). (b) Individual responses of two representative RGCs (left and right panels) are shown by the raster plots, whereas mean responses are reflected by the PSTHs to light-(upper) and electrical stimulation (bottom), respectively. Histogram displays the reduction of response delays when stimuli were switched from light- (top panels) to electric stimulation (bottom panels) for the examined RGCs (n = 5). (c) Besides shorter latencies, electrical stimulation of RGC somata resulted in a statistically significant shrinkage of the latency range (by subtracting response delays of the slowest and fastest responses of each cell) for the examined cell population (p < 0.05; paired t-test).

