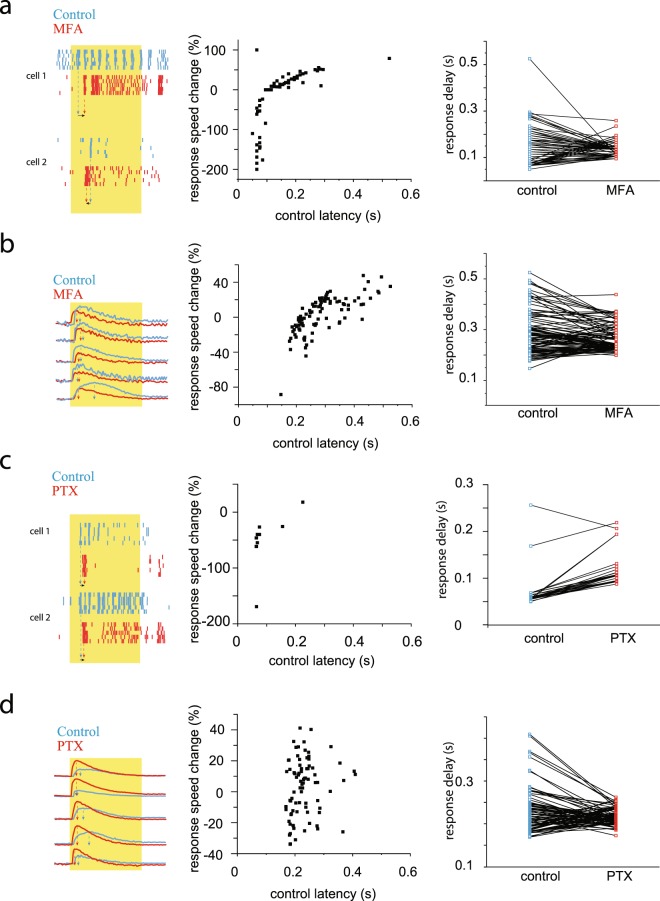
Figure 6.
Lateral Inhibition and GJ Mediated Signaling Considerably Alter RGC Response Delays. (a) Representative RGC responses (to the left) in control conditions (blue) and after a GJ blockade (red; MFA 40 μM concentration). Histogram in the middle displays MFA induced changes of PSTH-based response delays for the examined RGC population (n = 159; ON/OFF:107/52). Diagram to the right shows a reduction in the RGC response delay range due to MFA application. Response delay changes were calculated as (delaycontrol-delaymfa)/delaycontrol * 100). (b) RGC light responses in control conditions (blue) and after a GJ blockade (red; MFA 40 μM concentration; left panel). Histogram in the middle displays MFA induced changes of Ca++-transient light response delays for the examined RGC population (n = 95); and diagram to the right shows the reduction of RGC response latency range following MFA application. (delaycontrol-delaymfa)/delaycontrol * 100). (c) Representative RGC responses in control conditions (blue) and under the blockade of GABA-ergic signaling (red; PTX 50μM concentration). Histogram in the middle displays PTX induced changes of PSTH based response delays for the examined RGC population (n = 31). Diagram to the right shows the GABA blockade induced changes of RGC response delays and also the reduction of the delay range induced by PTX application. Response delay changes were calculated as (delaycontrol-delayptx)/delaycontrol * 100). (d) RGC Ca++-transient light responses in control conditions (blue) and after following PTX incubation (red; PTX, 50 μM concentration). Histogram displays PTX-induced changes in Ca++-transient light response delays for the examined RGC population (n = 83; middle panel), while the diagram to the right shows the reduction in the latency range induced by the pharmacological intervention. Response delay changes were calculated as (delaycontrol-delayptx)/delaycontrol * 100.

