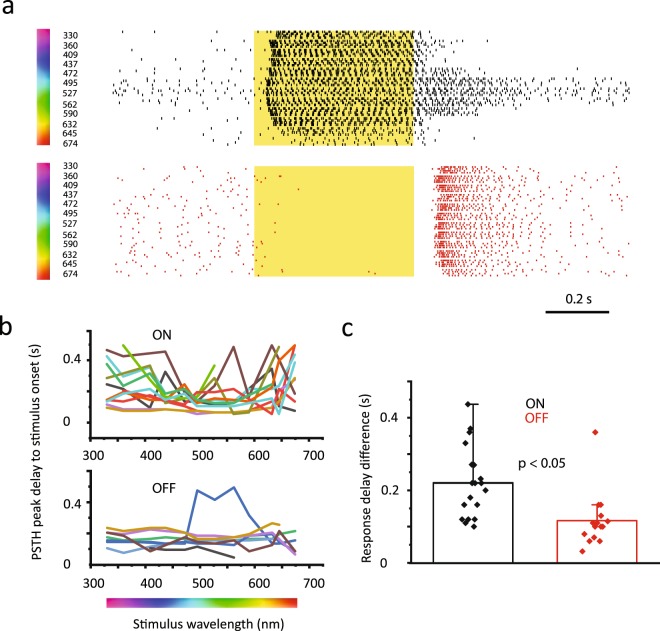
Figure 8.
RGC Response Delays Vary with Spectral Features of Light Stimuli. (a) Raster diagrams show representative ON-(top) and OFF-(bottom) RGC responses to photopic light stimuli of various spectral lengths (wavelengths are shown by the number to the left; six trials for each stimulus). Clearly, response delays were prone to stimulus wavelength changes. (b) Histogram displays variations of response delays (y axis) of individual RGCs (color coded) as a function of stimulus wavelength (x axis). ON-RGCs (top graph) seemed to be more sensitive to stimulus wavelength changes than those of OFF-RGC (bottom graph) counterparts. (c) Bar graph showing maximum response delay differences for both ON- and OFF-RGC responses. ON-cells showed significantly larger variation in the response delays than the examined OFF-RGC population (p = 0.0004; Mann-Whitney test).

