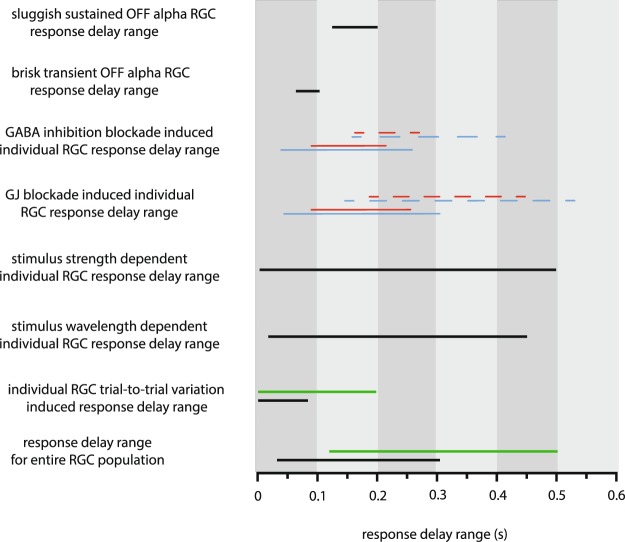
Figure 9.
Summary of Response Latency Ranges in Various Stimulating Circumstances. Diagram displays a comparison for response latency variations and changes observed in this study. Stimulating and recording paradigms are shown to the left, delay ranges are represented by horizontal bars (black - extracellular recordings, green - Ca++-imaging experiments, blue and red – control and pharmacological conditions for extracellular recordings (solid lines) and Ca++-imaging experiments (dashed lines)).

