
Figure 1.
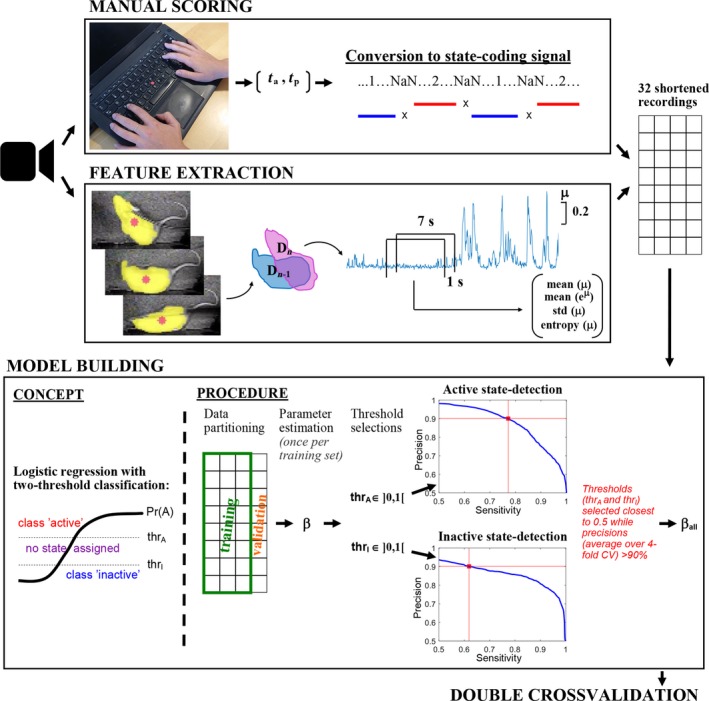
Schematic showing the steps of the development of the locomotive state detection algorithm. Video recording of rats was used to obtain labelled data from manual scoring as well as a mobility signal using EthoVision XT. Labelled data were obtained by having an experienced technician mark the times of state‐change, t a and t p, through time‐registrated keyboard presses. The times of state‐change were converted to a continuous discrete signal coding for behaviour where 1‐s before each registration of state‐change was marked with NaN‐values to exclude uncertain transition periods in the subsequent training of the classifier. The developed state‐detection algorithm was based on features of the mobility signal, μ, obtained with EthoVision software which reflected the change in the detected (yellow) area of the rat over video‐frames. A range of features of μ were calculated in windows of 7 s moving in steps of 1 s, and four features were selected for use in the classification. The 32 recordings (manual scoring and feature signals) were shortened to have equal representation of both states before training the classifier. The probability for active state, Pr(A), (and implicitly inactive state) given the features was predicted using binomial logistic regression, and two probability‐thresholds, thrA and thrI, were used to assign samples to the active state when Pr(A) > thrA and the inactive state when Pr(A) < thrI. Thresholds were selected by sweeping through values from zero to one in steps of 0.01 and subsequently choosing thrA‐ and thrI‐values closest to 0.5 for which the resultant state‐detection precisions (based on fourfold cross‐validation) were above 90%. Finally, the logistic regression parameters were estimated based on all 32 recordings. The classification performance of the whole model building procedure was tested using double‐cross‐validation. [Colour figure can be viewed at http://www.wileyonlinelibrary.com]