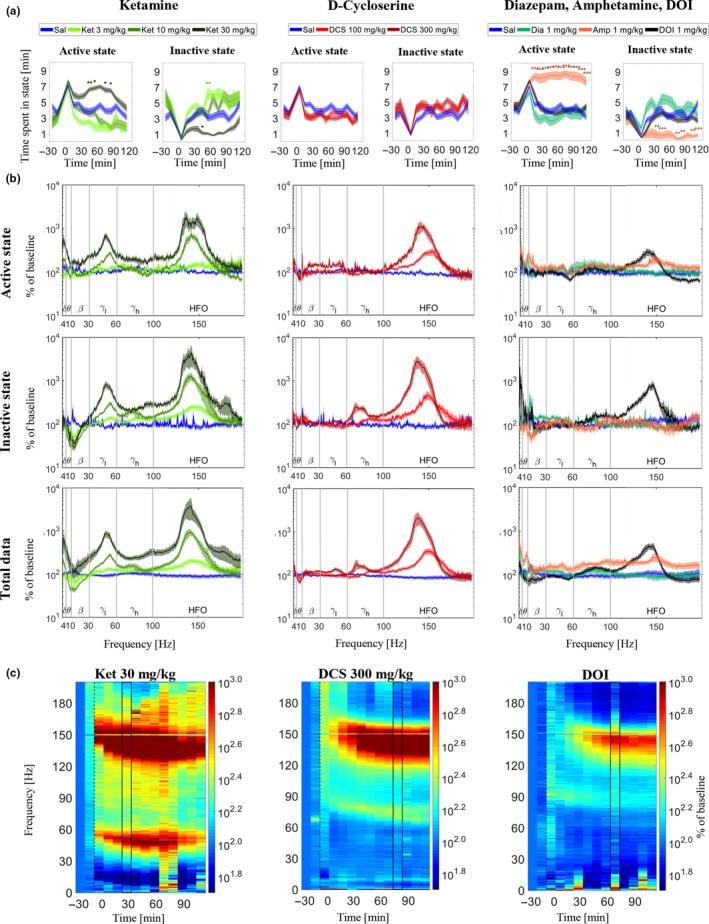
Figure 3.

Drug effects on locomotion and LFP power spectra from right medial prefrontal cortex. (a) Effects of ketamine (Ket), d‐cycloserine (DCS), DOI, amphetamine (Amp), and diazepam (Dia) on time spent in the active and inactive state (on average over rats) as determined by the automatic LS detector. Standard error of the mean (SEM) given as the shaded areas above and below the graphs. Time‐intervals where drug‐induced changes differ from saline are marked above the graphs when p < 0.05 (*), 0.01 (**), or 0.001 (***). (b) Power spectra based on 10‐min time intervals after injection for Ket (30–40 min after), DCS (80–90 min after), and for DOI, Dia, and Amp (70–80 min after) calculated from active state, inactive state, and total data. The power spectra are baseline‐corrected and averaged over rats, and shaded areas mark the SEM. (c) Heatplots showing averaged baseline‐corrected power spectra during inactivity for each 10‐min time interval of the recordings in mPFCright for administrations of the large doses of ketamine and DCS as well as DOI. The two black lines in the heatplots frame in the time‐intervals shown in part B. [Colour figure can be viewed at http://www.wileyonlinelibrary.com]
