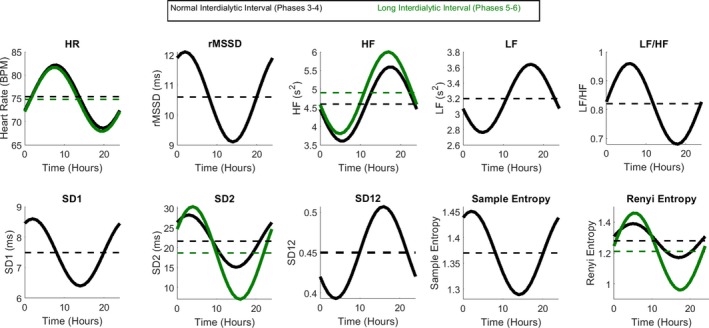
Figure 4.

Circadian rhythm in heart rate and HRV during a 1‐day‐ (black) and 2‐day‐long (green) interdialytic interval. Mesor is shown as a dashed line. BPM indicates beats per minute; HF, high‐frequency power; HR, heart rate; HRV, heart rate variability; LF, low‐frequency power; rMDDS, root mean square of the successive normal sinus to normal sinus intervals differences; SD 1, the SD of the Poincare plot cloud of points in the direction perpendicular to the line‐of‐identity; SD 12, SD 1/SD 2 ratio; SD 2, the SD of the cloud of points in the direction of the line‐of‐identity.
