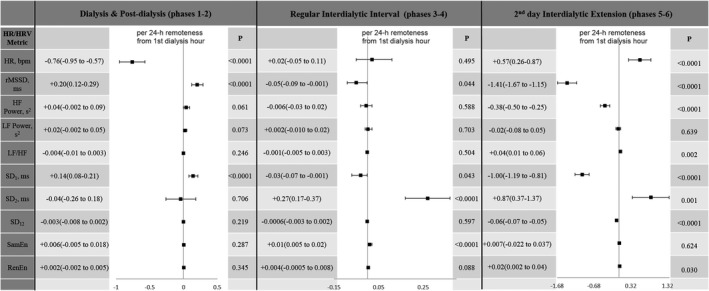
Figure 5.

Association of the phase of dialysis with heart rate and HRV after adjustment for circadian rhythm and clinical characteristics. bpm indicates beats per minute; HF, high‐frequency power; HR, heart rate; HRV, heart rate variability; LF, low‐frequency power; RenEn, Renyi entropy; rMDDS, root mean square of the successive normal sinus to normal sinus intervals differences; SamEn, sample entropy; SD 1, the SD of the Poincaré plot cloud of points in the direction perpendicular to the line‐of‐identity; SD 12, SD 1/SD 2 ratio; SD 2, the SD of the cloud of points in the direction of the line‐of‐identity.
