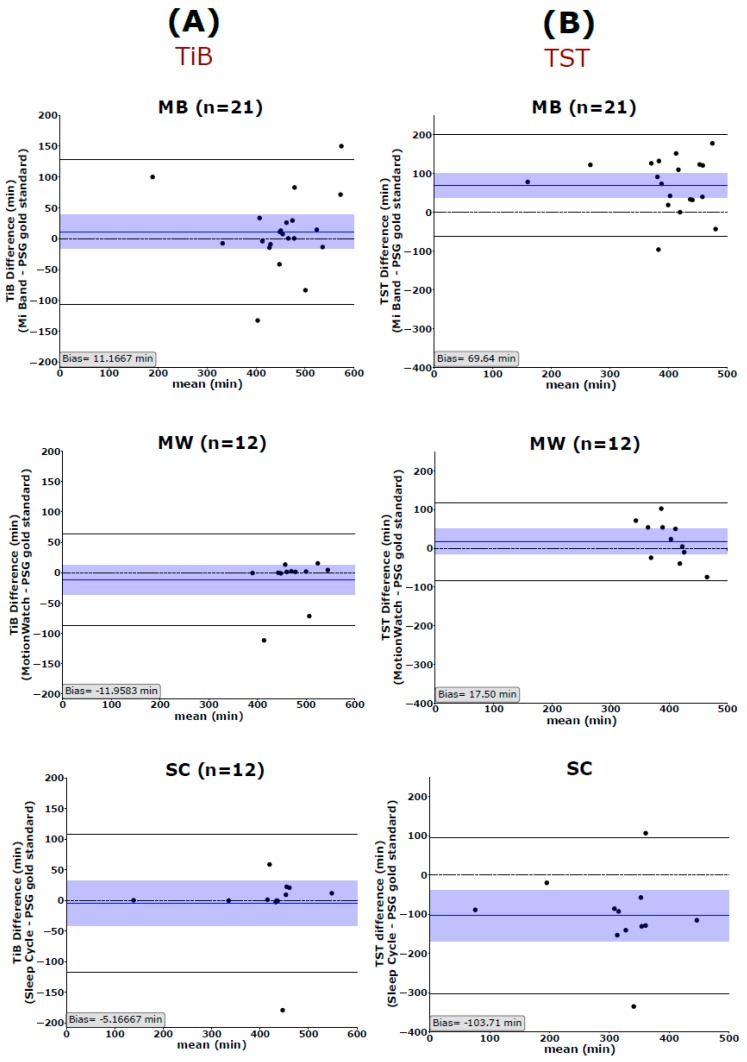
Figure 1.
Bland–Altman plots show the agreement of Mi Band (MB), MotionWatch (MW), and Sleep Cycle (SC) with the polysomnography (PSG) in measuring (A) time in bed (TiB) but not (B) total sleep time (TST). The blue horizontal line represents the mean difference between the two measurements, and the shaded blue area represents the 95% CI of the mean difference. Black horizontal lines mark the 1.96 SD from the mean. The black dashed line is the line of equality (difference = 0). TiB: time in bed, TST: total sleep time, MB: Mi Band, MW: MotionWatch, and SC: Sleep Cycle application.

