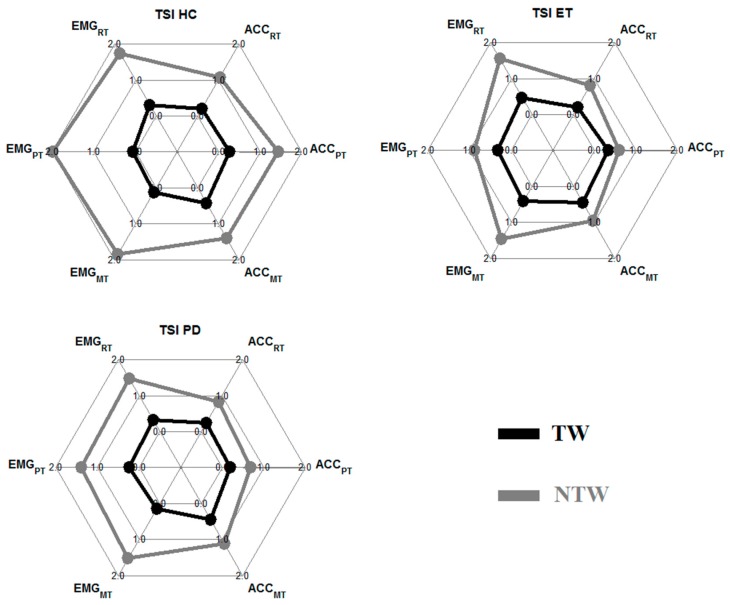
Figure 2.
Group mean tremor stability index (TSI) of the healthy control (HC), essential tremor (ET), and Parkinson’s disease (PD) groups. In each spider plot on the left side are the results of the EMG data (top to bottom: RT, PT, and MT), and on the right side are the results of the accelerometer data. In black, the TW results are displayed, and in grey, the results of the NTW.

