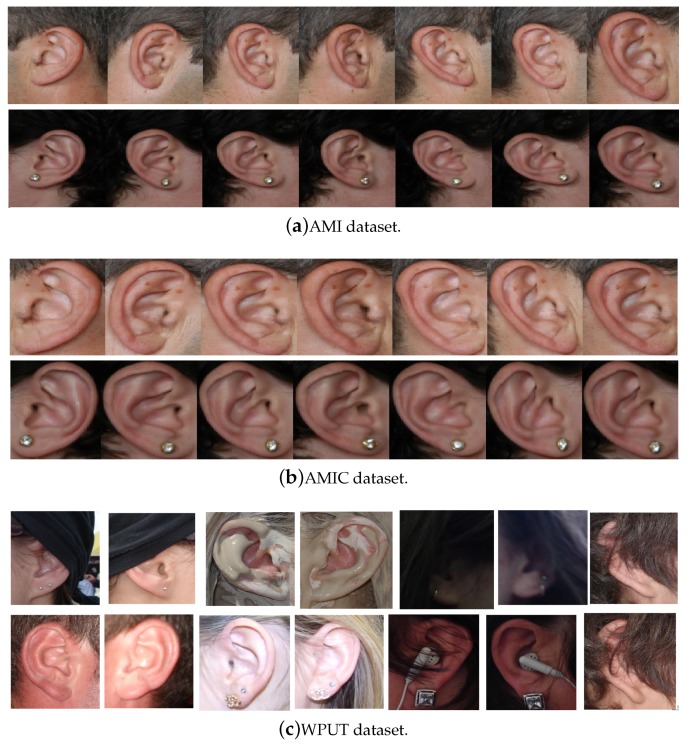
Figure 3.
Sample images for two distinct subjects from the AMI and AMIC ear datasets, where images in the bottom (b) are tightly cropped from the profile images shown at the top (a); while images in (c) show ear images of selected individuals to illustrate the wide variability of image distortions that exist in the WPUT ear dataset.

