
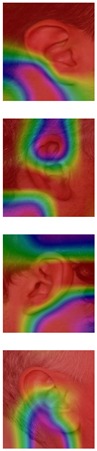
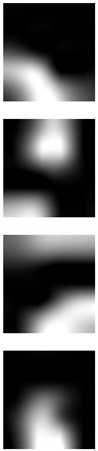
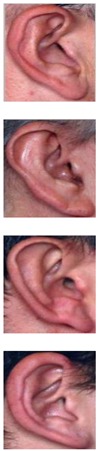
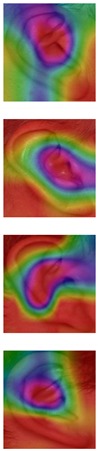
Table 3.
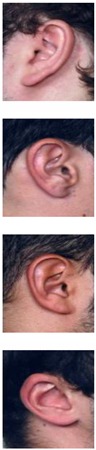
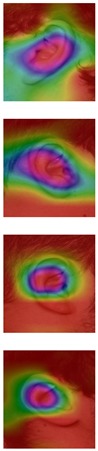
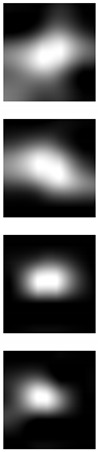
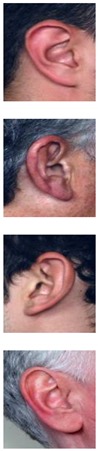
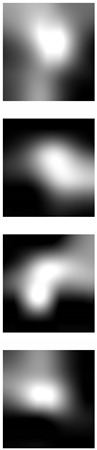
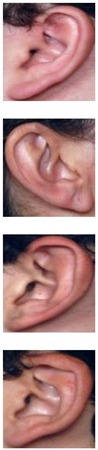
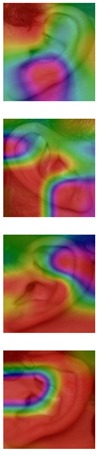
Qualitative examples of gradient-weighted class activation map (Grad-CAM) visualization results for four correctly classified and four misclassified ear images from each ear dataset. The results were generated using the VGG-16 model trained with random weight initialization. For a correct classification, the model considers some discriminative regions and more specifically the geometric structure of the ear shape, while misclassification seems to be the result of utilizing misleading regions such as the auxiliary parts of the hair and neck.
| Dataset | Correctly Classified | Misclassified | ||||
|---|---|---|---|---|---|---|
| Original | Grad-CAM | Heatmap | Original | Grad-CAM | Heatmap | |
| AMI |
|
|
|
|
|
|
| AMIC |
|
|
|
|
|

|