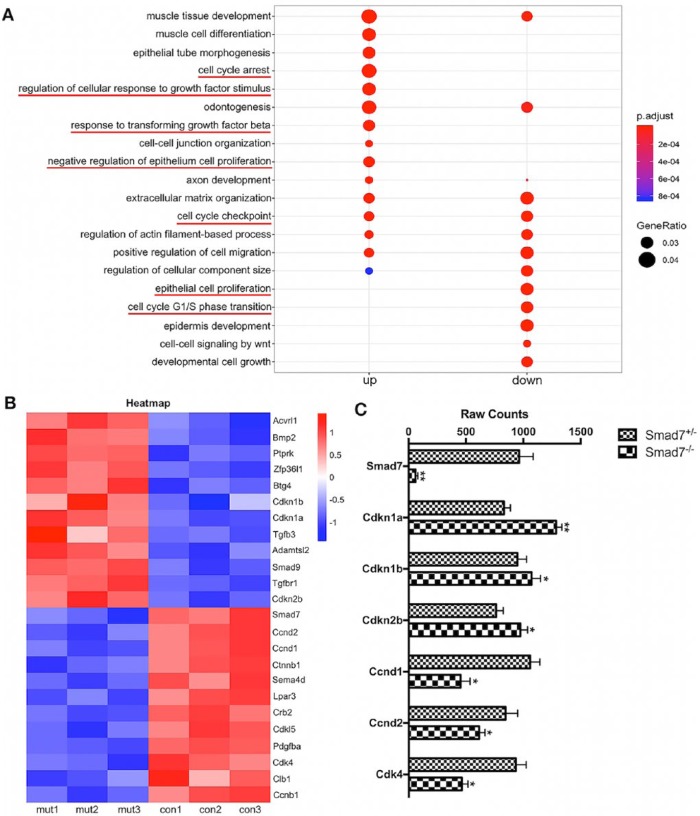
Figure 3.
RNA sequencing (RNA-seq) analysis identifies the gene expression profile regulated by Smad7. (A) Gene ontology (GO) analysis shows that genes that were upregulated and downregulated, respectively, in the Smad7−/− first mandibular molar at E15.5. (B) Heatmap shows z scores (interpreted as a measure of SD away from the mean) for some selected genes from E15.5 RNA-seq data. The color scheme is based on the z scores, with upregulation in red, downregulation in blue, and undetermined directionality in white. (C) Raw counts from RNA-seq illustrate the magnificently decreased expression levels of Smad7 and 6 selected genes, including Cdkn1a, Cdkn1b, Cdkn2b, Ccnd1, Ccnd2, and Cdk4, that are critical for cell proliferation. Statistical analysis was performed using Student’s t test. *P < 0.05. **P < 0.01. This figure is available in color online.

