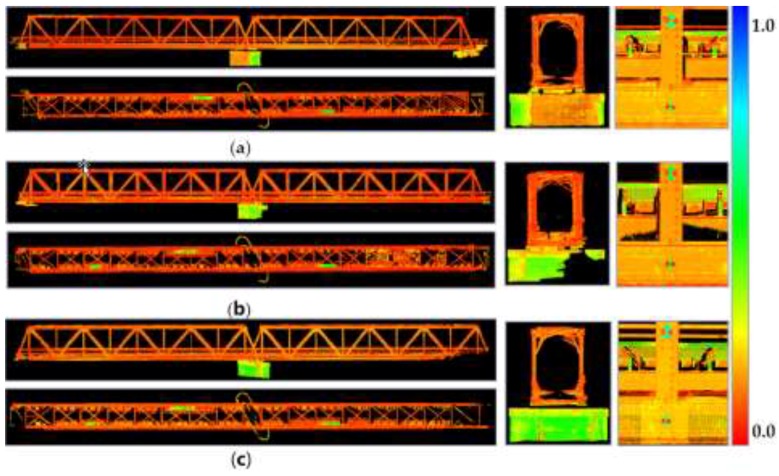
Figure 3.
Point clouds of the bridge after registration by using the scale of intensity map (captured by Z + F 5010 and visualized in Leica Cyclone 9.2) in order: back view, top view, cross-section, detail; (a) first series; (b) second series (TLS data before static loading in [42]; (c) third series.

