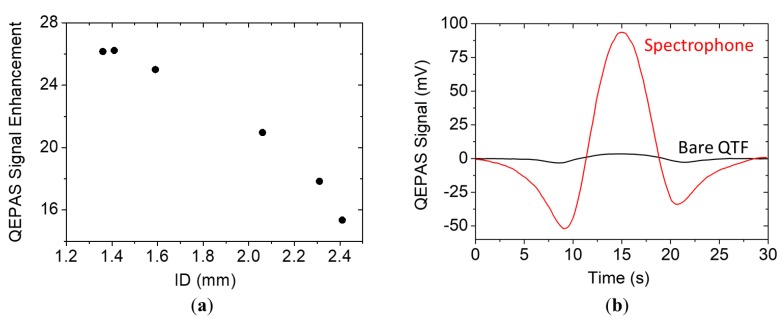
Figure 6.
(a) Signal enhancement of the spectrophone signal with respect to the bare QTF signal as a function of the tubes’ internal diameter when the optimal tube length was used for each ID. (b) QEPAS spectral scan of water absorption line acquired with the bare QTF (black solid line) and with a spectrophone composed of the QTF and a pair of resonator tubes having a length of 9.5 mm and internal diameter of 1.41 mm, both positioned 150 μm away from the QTF surface (red solid line).

