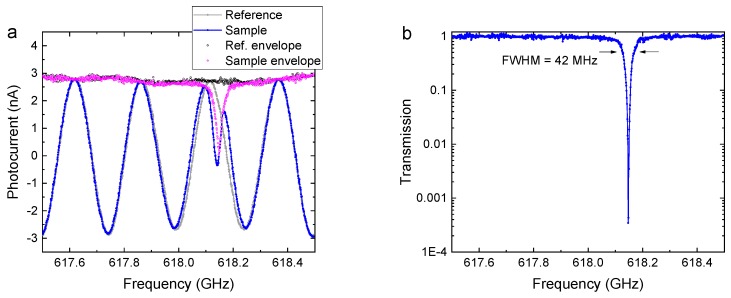
Figure 3.
(a) Frequency-domain signals of a reference (grey) and sample (red) scans. The coherent detection scheme gives rise to phase “fringes”, which appear as an oscillating pattern when the THz frequency is varied. A Hilbert transform yields the envelope spectra of reference (black) and sample (pink). (b) The sample transmission spectrum (the square of the ratio of the sample and reference envelope data) reveals the whispering-gallery-mode resonance with an FWHM linewidth of 42 MHz. Courtesy of Dominik Vogt, University of Auckland, New Zealand.

