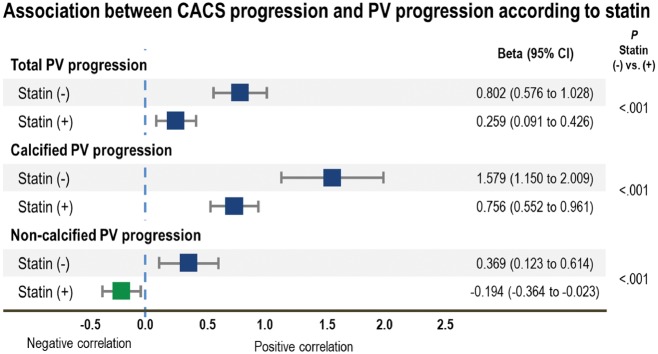
Figure 2.
Progression in CACS represented coronary atherosclerotic PV progression differently depending on statin use in multivariate linear regression analysis adjusted for age, sex, race, hypertension, diabetes mellitus, dyslipidaemia, smoking history, family history of CAD, body mass index at baseline, PV and CACS at baseline, changes in low-density lipoprotein level, and difference in vendors and tube voltages between the baseline and follow-up CCTAs. CACS, coronary artery calcium score; CI, confidence interval; PV, plaque volume; Statin (−), non-statin group; Statin (+), statin-taking group.

