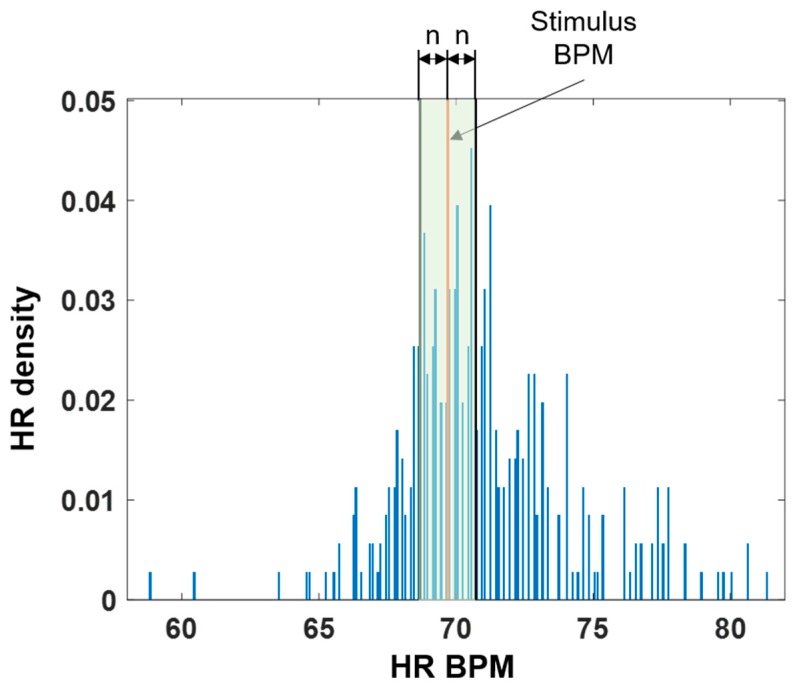
Figure 3.
Example of a heart rate density distribution from subject 1 under the −3% stimulation condition at an n of 2.0. The stimulus BPM was computed on the basis of the mean HR calculated over the previous 5 min. Orange line: position of the stimulus BPM. Shaded green: area of the densities between stimulus BPM ± n BPM, n = 0.5, 1.0, and 2.0 BPM.

