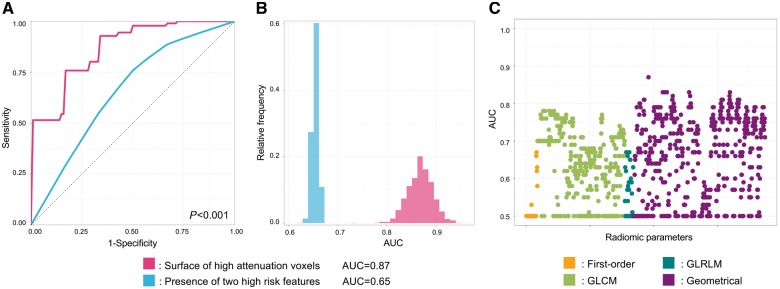
Figure 5.
Diagnostic evaluation of radiomics and conventional CT parameters to identify radionuclide activity on NaF18-PET. (A) Receiver operating characteristic curves of the best radiomic (pink): surface of high attenuation voxels (component 8 when discretizing to eight equally sized bins); and the best conventional (blue) parameter: presence of two high-risk features, which were calculated by averaging the receiver operating characteristic curves after 1000 repeats of the five-fold cross-validation process. (B) Distribution of the AUC values calculated during the five-fold cross-validation process repeated 1000 times. Dashed lines indicate the means of the AUC distributions. Results are based on the analysis of 44 plaques of 25 patients. (C) Manhattan-plot of radiomic features’ AUC values. Radiomic parameters are situated in consecutive order on the x axis, while their corresponding AUC values to identify radionuclide activity on NaF18-PET are shown on the y axis. AUC, area under the curve; GLCM, grey level co-occurrence matrix; GLRLM, grey level run length matrix.

