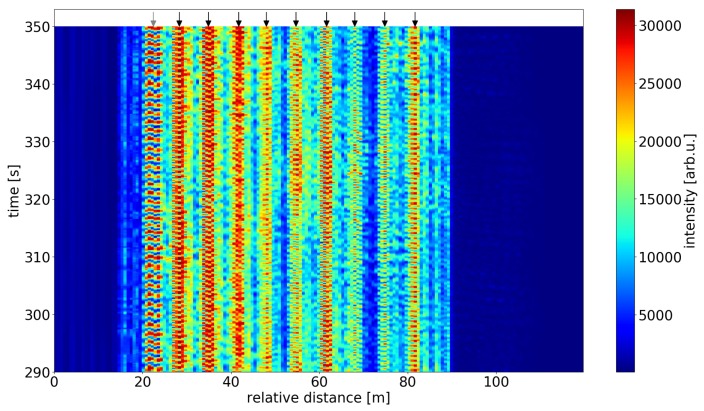
Figure 6.
C-OTDR raw data along scatterer sensing fiber during heating. The black arrows mark the sensor positions used for sensing. The local patterns result from backscatter interference from pairs of consecutive scattering dots and are highly sensitive to thermal and/or mechanical excitation. The signal shown at the position indicated by the grey arrow stems from interference between the reflections from a lead-in fiber splice and the first scattering dot, respectively.

