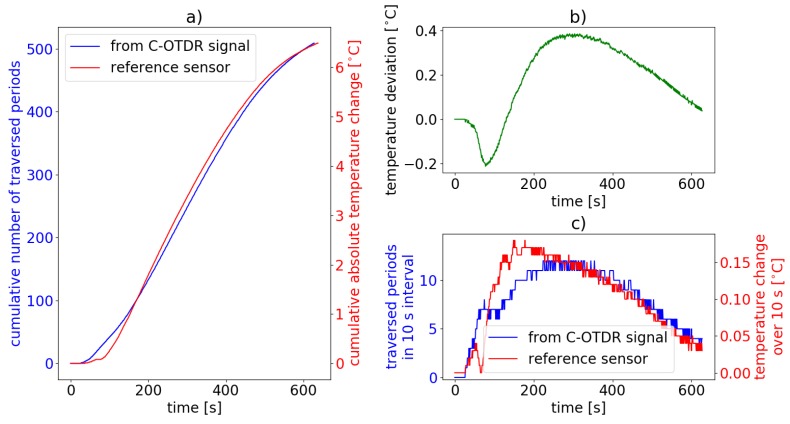
Figure 8.
Distributed temperature gradient sensing result for single sensor position during heating process. (a) cumulative number of traversed periods from the C-OTDR trace (blue) and temperature as measured by the reference thermistor (red), (b) deviation between measured relative temperature increase and temperature increase as calculated from Equation (6), (c) corresponding number of traversed periods (blue) and simultaneously measured temperature changes (red), both over 10 s intervals.

