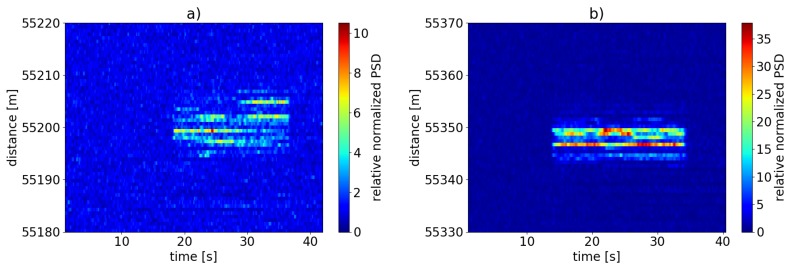
Figure 12.
Normalized sum of power spectral density (PSD) at excitation frequency Hz and its harmonics (Equation (8)) at a measurement distance of 55 km on the basis of the spectral data shown in Figure 11a) for unmodified standard SMF; (b) for the case using fiber-inscribed scattering dots. The increase in sensitivity and the difference in fading behavior is clearly visible. Note the different scales of the color coding.

