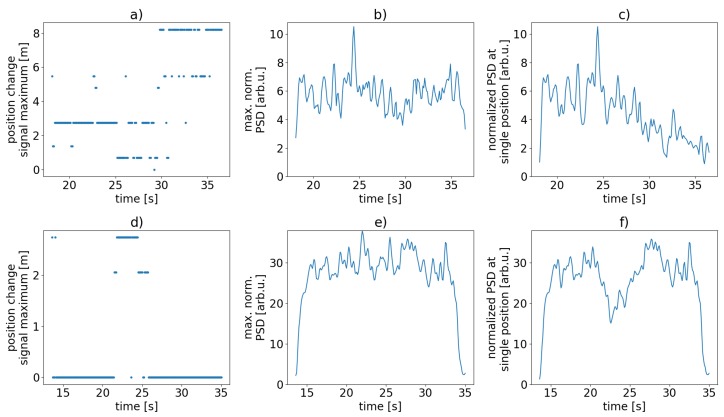
Figure 13.
Measures showing sensitivity fading over time for the standard fiber (a–c) and for the scatterer fiber (d–f). (a,d) relative change of sensor position with the maximum signal strength (normalized PSD sum, Equation (8)); (b,e) corresponding signal strength; (c,f) signal strength in a single sensor range bin over time. Note the different scales.

