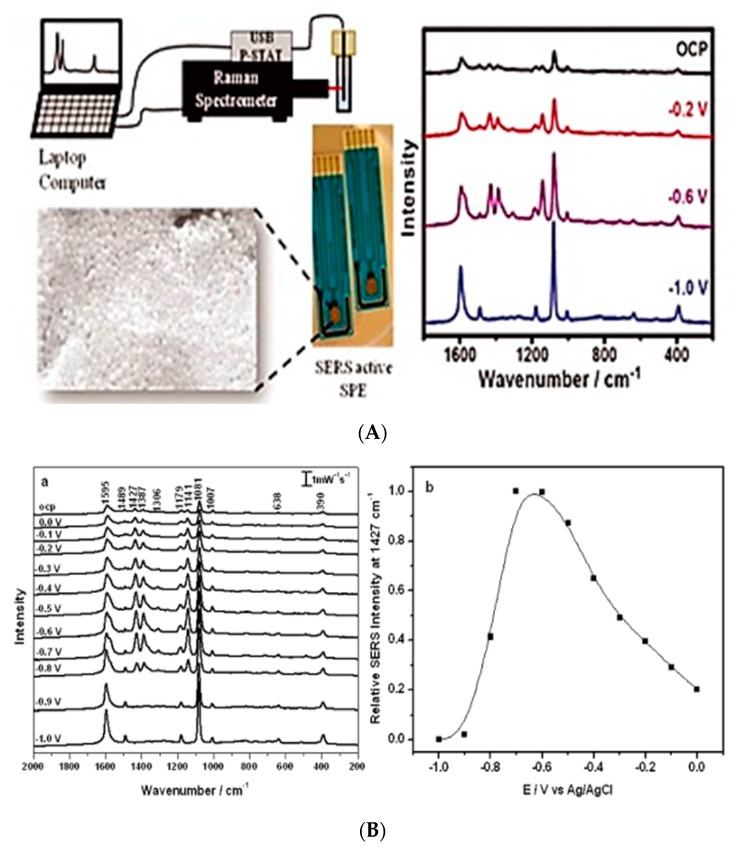
Figure 5.
(A): Scheme of the miniaturized equipment with a SEM micrograph of the electrode surface, with a typical Raman spectral profile, as output signal. (B) Shows on (a) a typical electrochemical Surface Enhanced Raman Spectroscopy (SERS) profile for a para-aminothiophenol modified electrode; (b) a typical SERS profile (for a specific analyte, such as p,p′-dimercaptoazobenzene_DMAB) depending on its redox potential. Reproduced and reprinted with permission from [14].

