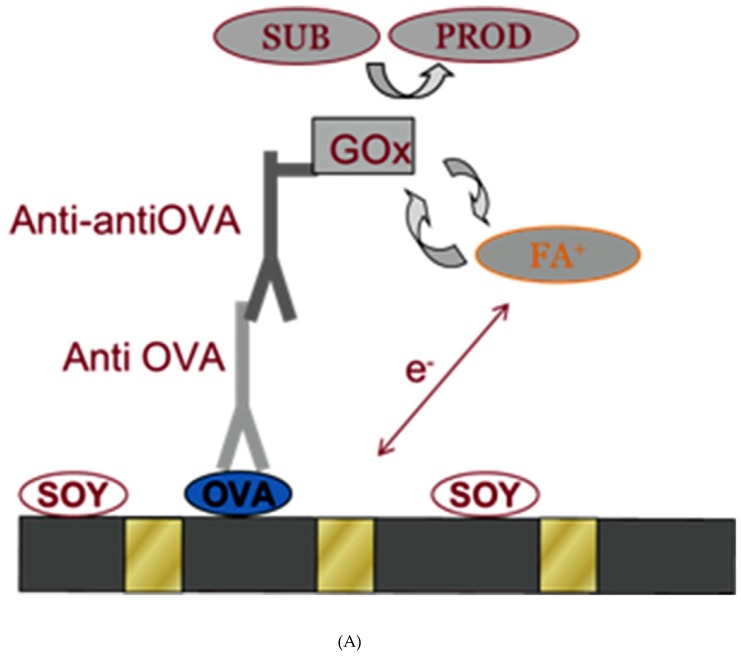
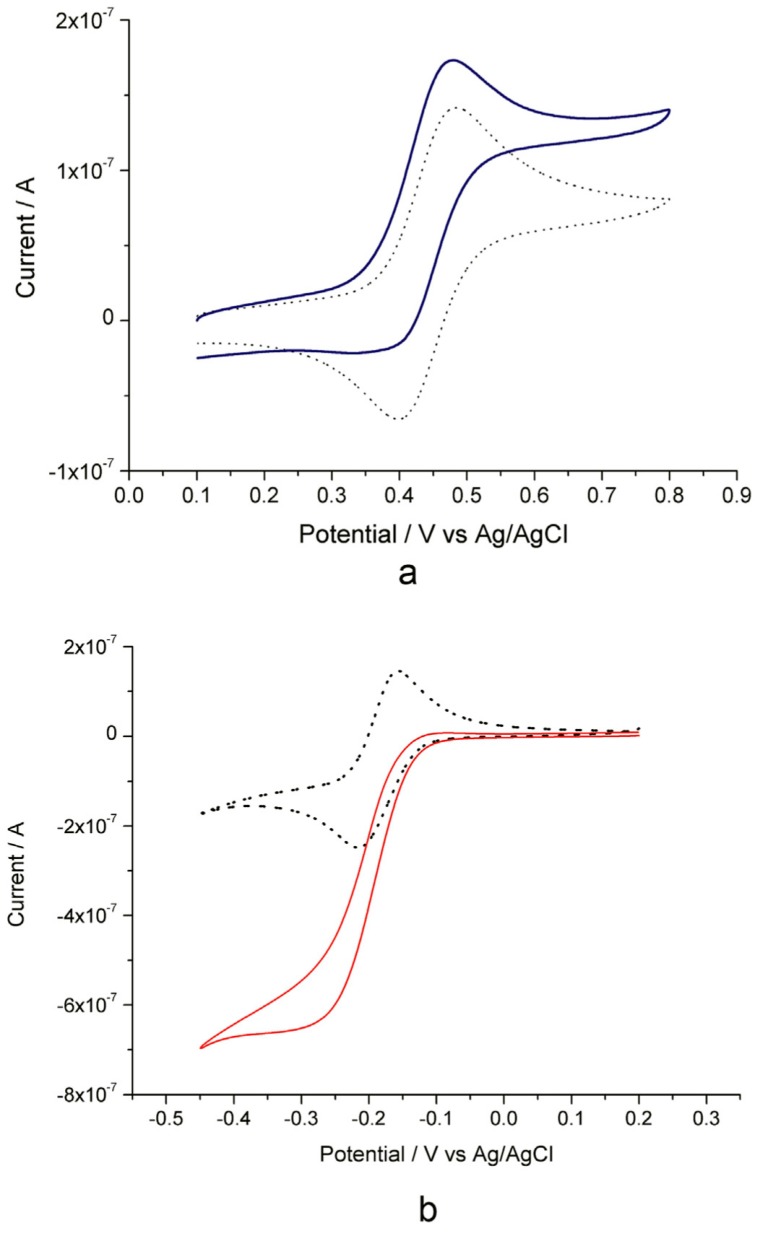
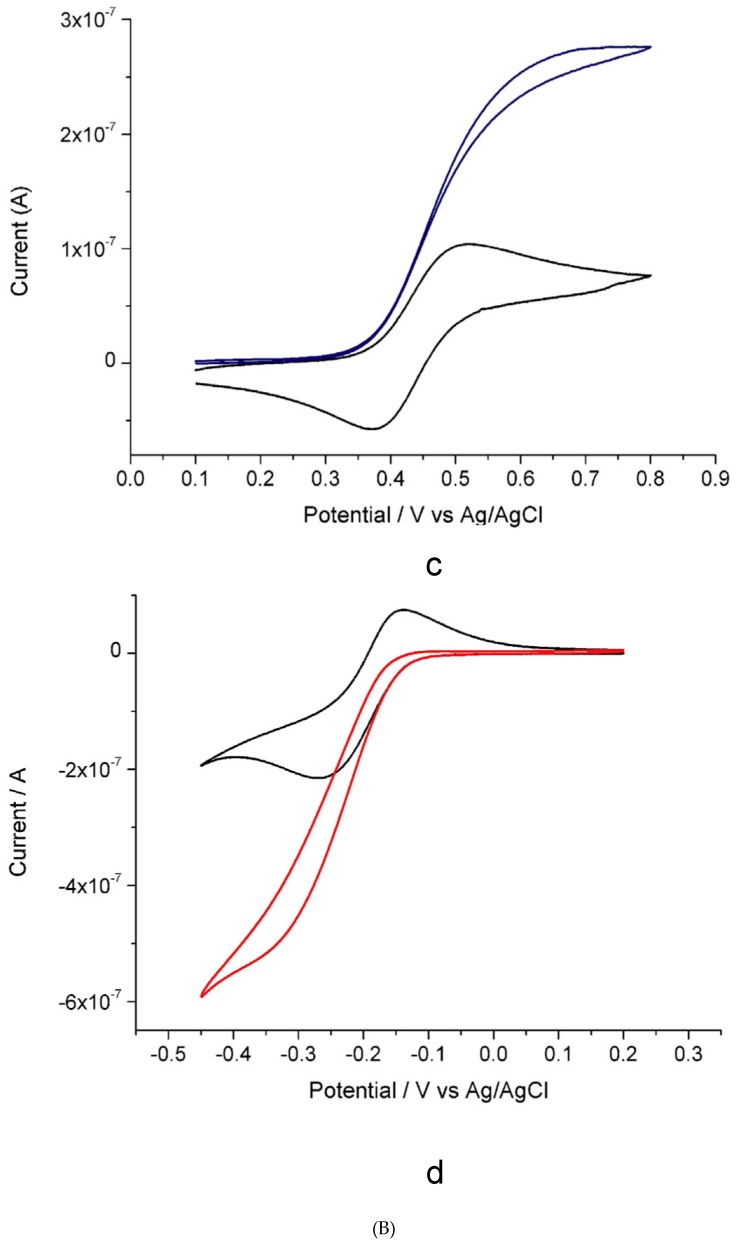
Figure 8.
(A): Scheme of the immunosensor. (B): Cyclic Voltammograms reported on the left show: (a) CVs of OVA-immunosensor after incubation in the extract canvas, before and after the addition of glucose; (b) CVs of methylene blue at NEE IgY immunosensors incubated with canvas sample, before and after the addition of hydrogen peroxide. (c) and (d) show the same conditions of (a) and (b) but working with the original sampled Virgin. Reproduced and reprinted with permission from [18].


