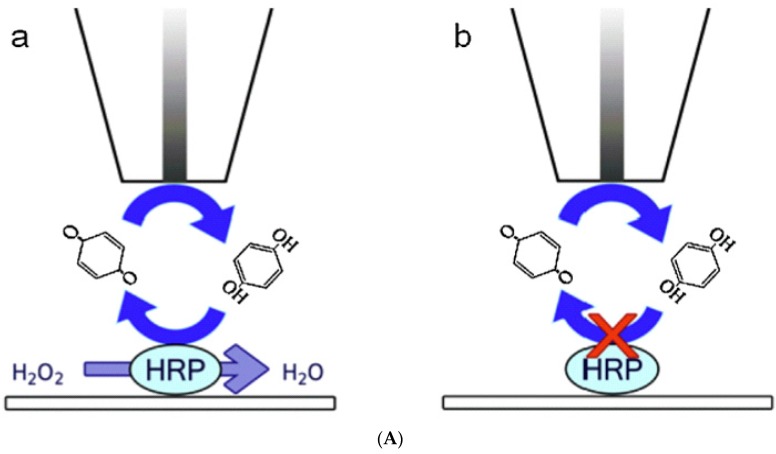
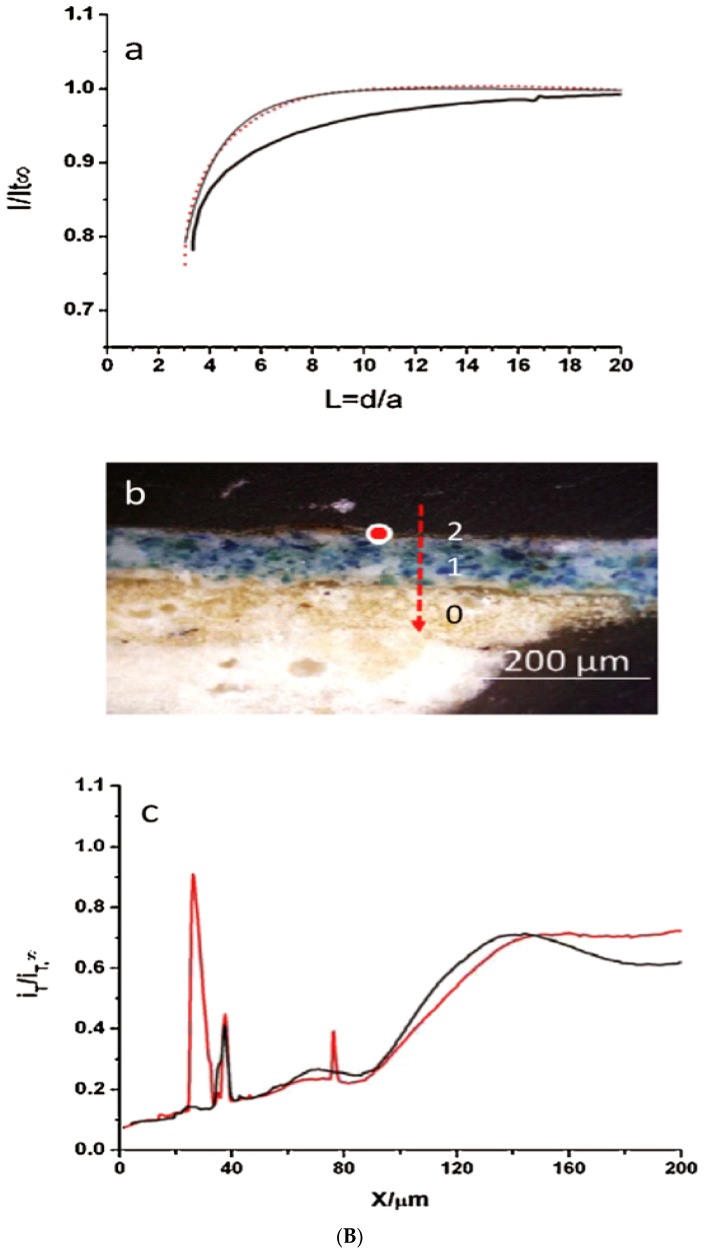
Figure 9.
(A): is a scheme of the BQ detection. In (B), there are: (a) SECM approach curve obtained with and without H2O2; (b) represents the optical image of sample; (c) represents SECM scan plots, acquired with and without hydrogen peroxide. Reproduced and reprinted with permission from [19].


