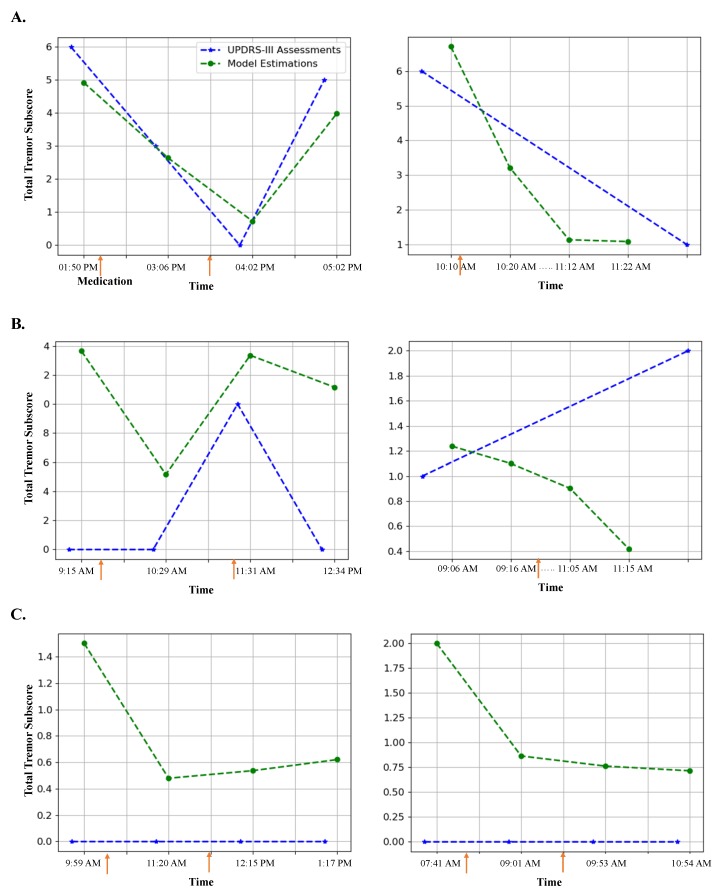
Figure 3.
Examples of total tremor estimation over time using the gradient tree boosting model in comparison with the estimation from the UPDRS-III assessment. (A) Two examples with high correlation; (B) Two examples with moderate to low correlation; (C) Two examples from non-tremor-dominant subjects. The PD medication intake time is denoted as an orange arrow. Note that in cases of the subjects in the right-hand side of A-B, only two UPDRS-III assessments were performed while four tremor estimations were performed using our developed model.

