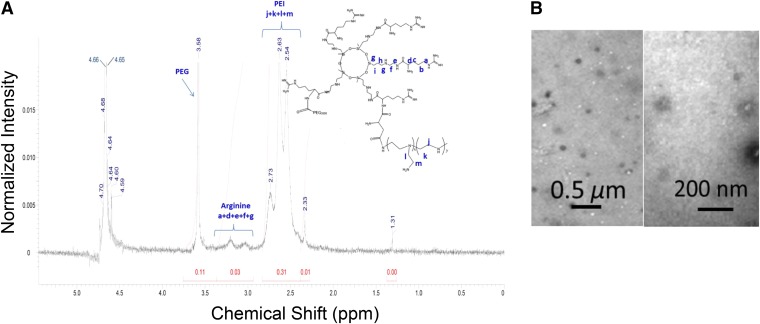
Fig. 1.
Spectral characterization of polymer and morphologic analysis of siRNA polyplex. (A) 1H NMR spectra P(SiDAAr)5PEG3 shows the polymer’s PEG (−CH2-CH2-O−) groups, as well as arginine, and PEI’s ethylene protons (−CH2−). (B) TEM images of 1/4 siRNA/P(SiDAAr)5PEG3 polyplex at low (×23,000) (left) and high (×68,000) (right) magnifications.

