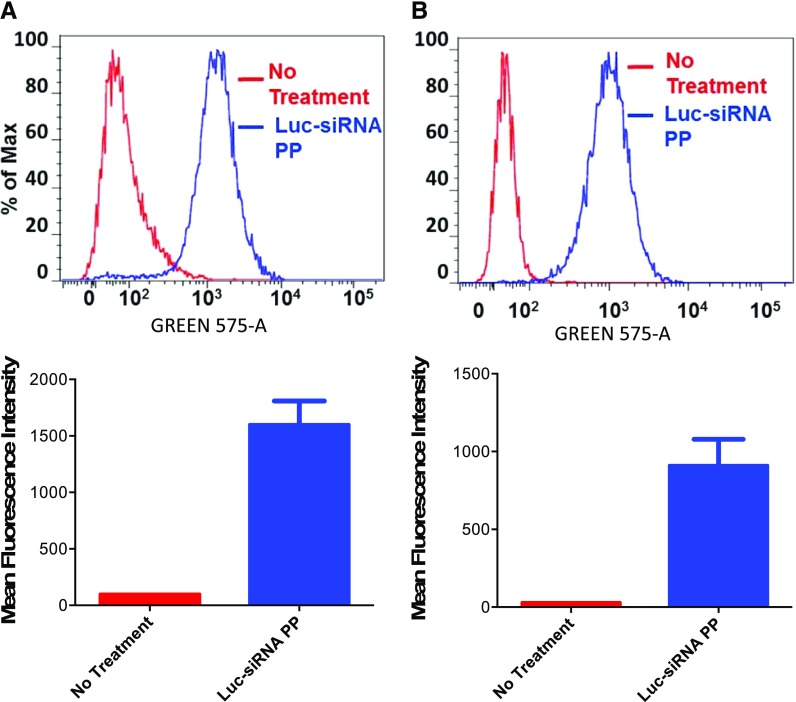
Fig. 4.
Polyplex uptake in metastatic and resistant breast cancer cells. Uptake in MDA-MB-231-Luc-D3H2LN (A) and MCF-7/Adr cell lines (B) by flow cytometry and the respective mean fluorescence intensity following incubation of cells with polyplex for 4 hours. Luc-siRNA PP, cells that were treated with polyplex prepared with TRITC-conjugated polymer; No treatment, cells that were not treated with polyplex. y-Axis represents the data normalized to the maximum number of cells counted, whereas x-axis represents the channel used for measuring fluorescence signal. Untreated n = 1, treated n = 8 to 9 repeats of the same sample measurements.

