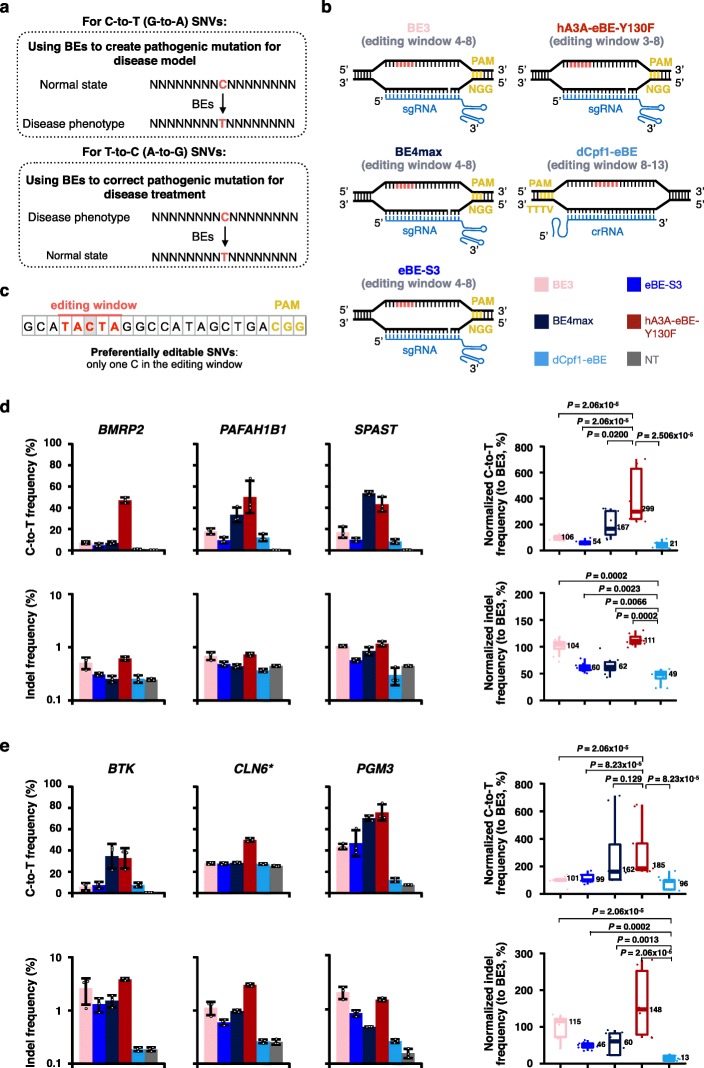
Fig. 1.
Comparison of base editing outcomes at pathogenic SNVs. a The diagram to illustrate the use of BEs in creating or correcting C-to-T (G-to-A) SNVs or T-to-C (A-to-G) SNVs to model or correct disease-related mutations. b The detailed target sites and editing windows of BE3, BE4max, eBE-S3, hA3A-eBE-Y130F, and dCpf1-eBE are shown. The cytosines were counted with the base distal to the PAM setting as position 1 in Cas9-based BEs and with the base proximal to the PAM setting as position 1 in Cpf1-based BEs. c The diagram to illustrate preferentially targetable SNVs. d Comparison of base editing outcomes at three pathogenic SNVs that can be created by five examined BEs in 293FT cells. e Comparison of base editing outcomes at three ABEmax-created pathogenic SNVs that can be corrected by five examined BEs in 293FT cells. The C-to-T editing (top) and indel (bottom) frequencies were individually shown at target sites in d and e. Asterisk, the T-to-C mutation created by ABEmax at the CLN6 gene locus is heterozygous, indicated by the high basal level of C-to-T correction by non-transfected control in e. NT, non-transfected. Data are shown as mean ± s.d. from three independent experiments. Statistical analysis of normalized C-to-T editing frequencies and indel frequencies at these three pathogenic SNV sites is accordingly shown in the right panel in d and e. Setting the ones induced by BE3 as 100%. P value, one-tailed Wilcoxon rank sum test. The median and interquartile range (IQR) are shown

