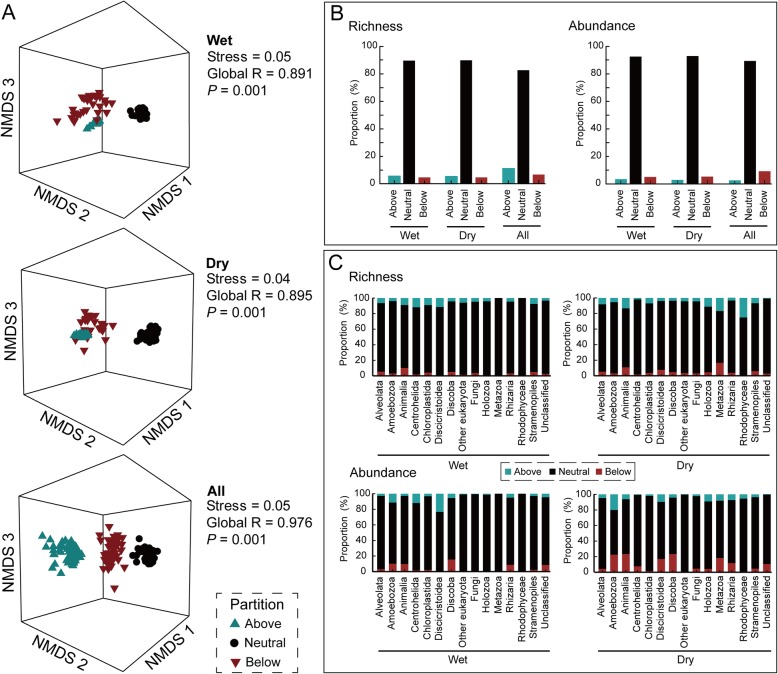
Fig. 5.
Neutral and non-neutral partitions of the metacommunity showed distinct community composition, diversity, and abundance. For each season group, communities were pooled and OTUs were then divided into separate partitions based on whether they were consistent within (in black) or deviated above (in light blue) or below (in dark red) the neutral prediction (color coding is consistent for all panels). a Non-metric multidimensional scaling ordination based on the Bray-Curtis similarity. b The distinct fitting proportions of microeukaryotic communities’ OTU and sequence numbers by the Sloan neutral model. c The distinct fitting proportions of richness (OTU number) and abundance (sequence number) of wet and dry seasons’ microeukaryotic supergroups. The other eukaryota represent incertae sedis eukaryota. The wet, dry, and all representing microeukaryotic communities from wet, dry, and both seasons, respectively

