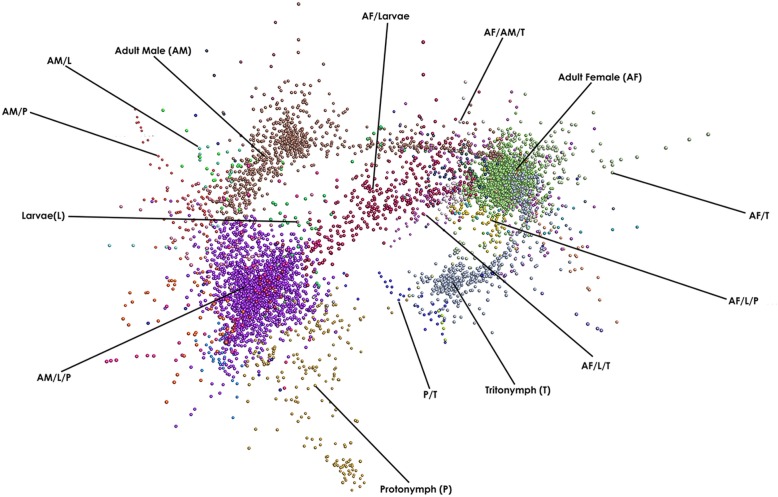
Fig. 4.
Network clustering of P. ovis stage-specific gene expression profiles. A Pearson correlation matrix was generated comparing the gene expression data derived from all of the P. ovis life-cycle stages. A network graph was constructed using a Pearson correlation cut off value of 0.9. Each node (coloured circle) represents a single P. ovis gene. The network graph was clustered using an MCL inflation value of 2.2 with each cluster of genes being represented by a different colour. Clusters of genes exhibiting expression profiles specific to either single- or multiple-developmental stages of P. ovis are labelled as follows: Larvae (L), Protonymph (P), Tritonymph (T), Adult Female (AF) and Adult Male (AM)

