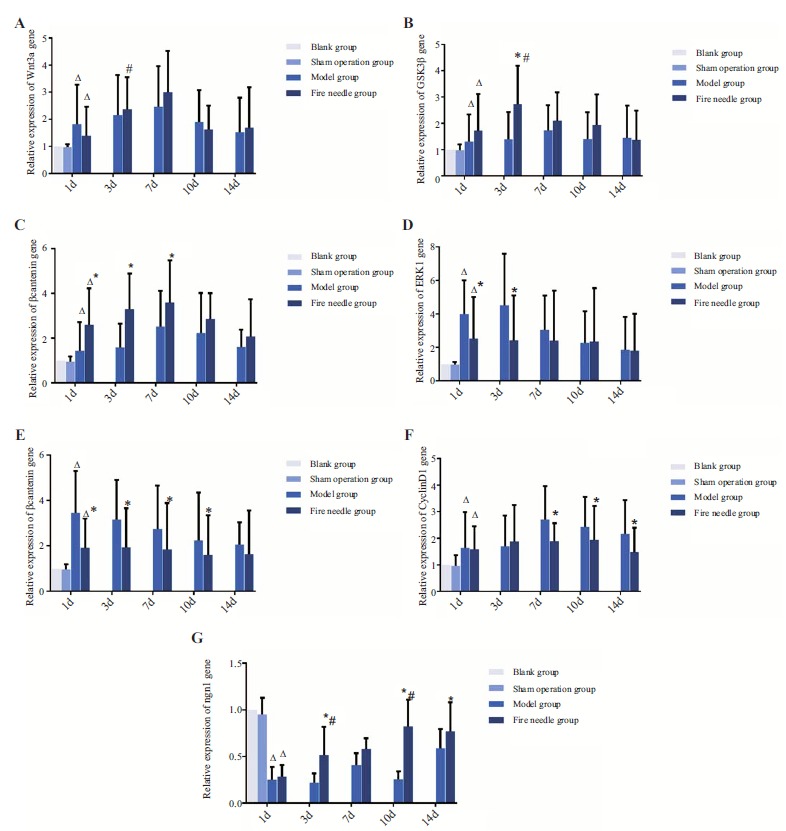
Fig. (4).

Gene expression of Wnt3a, GSK3β, β-catenin, ERK1, ERK2, cyclinD1, and ngn1 in each group of different time point.
Notes: *indicates that the difference between fire needle group and model group at the same time point is statistically significant (P<0.05).
# indicates that the difference between a time point and the point before that in the same group is statistically significant (P<0.05).
Δ indicates at d1, there is a significant difference among model group, fire needless group and sham operation group (P<0.05).
needle group were significantly higher than those at d1 and d7, respectively, and the levels at d3, d10, and d14 were significantly higher than those in model group (P<0.05, Fig. 4G).
