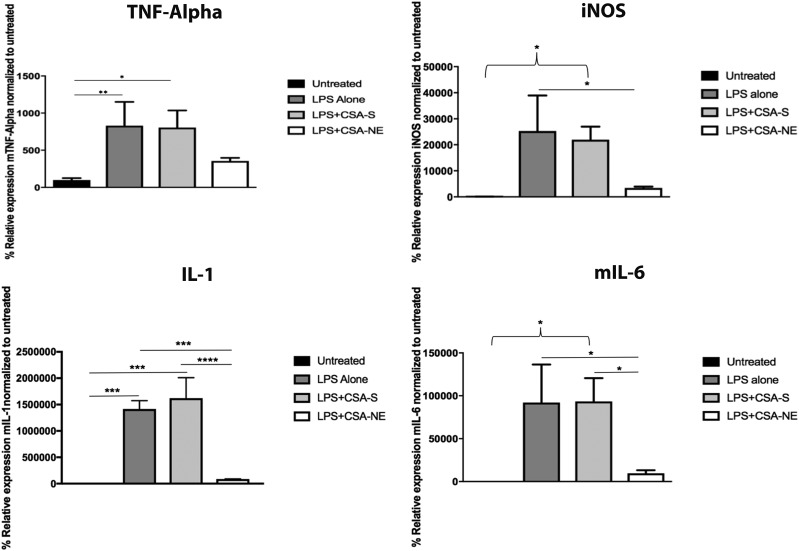
Fig. 2.
Inflammatory marker TNF-α–, iNOS-, IL-1–, and IL-6–specific mRNA results showing transcript expression in the J774A.1 macrophage cell line. With LPS treatment (positive control), there was a significant increase in mRNA expression of cytokines TNF-α (**P < 0.001), iNOS (*P < 0.05), IL-1 (***P < 0.0001), and IL-6 (*P < 0.05). With NE-SA (a positively charged CSA nanoemulsion) treatment, there was a significant decrease in expression of inflammatory cytokines iNOS (*P < 0.05), IL-1 (***P < 0.001), and IL-6 (*P < 0.05), compared with LPS-alone treatment. There was a significant decrease in the expression of IL-1 (****P < 0.0001) and IL-6 (*P < 0.05) for the NE-SA–treated group when compared with CSA-S (CSA in solution)–treated group. Untreated cells were used as a negative control. The values are reported as the mean ± S.D. (n = 3). All statistics were performed using one-way analysis of variance (Tukey’s multiple comparison test).

