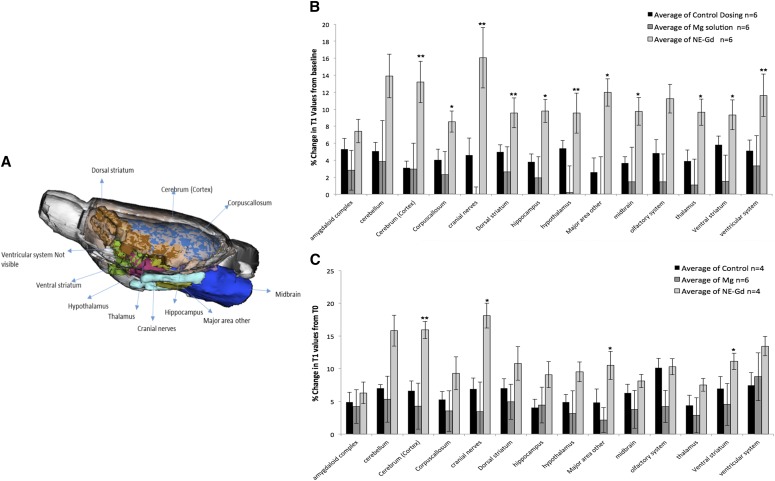
Fig. 3.
(A) Highlighted major brain regions in an anterior-to-posterior overlay in a rat brain atlas showing a significant change in T1 values for nanoemulsion-Gd (NE-Gd) compared with control or Magnevist at the time point of 25–30 minutes postdose. (B) Gd3+ ion–containing nanoemulsion distribution at the time point of 25–30 minutes compared with Magnevist and control in major regions of the brain. There was a significant percentage decrease in T1 values for different brain regions for NE-SA group (*P < 0.05; **P < 0.001) compared with control. (C) Nanoemulsion-Gd distribution at the time point of 55–60 minutes compared with Magnevist and control in major regions of the brain. There was a significant decrease in T1 values for the NE-SA group (*P < 0.05) compared with the control group. Student’s t tests were performed on the percentage change in T1 values for major brain regions and 172 specific brain regions in each subject. The t test statistics using 95% (*P < 0.05) and 99% (**P < 0.001) confidence levels, two-tailed distributions, and heteroscedastic variance assumptions were performed.

