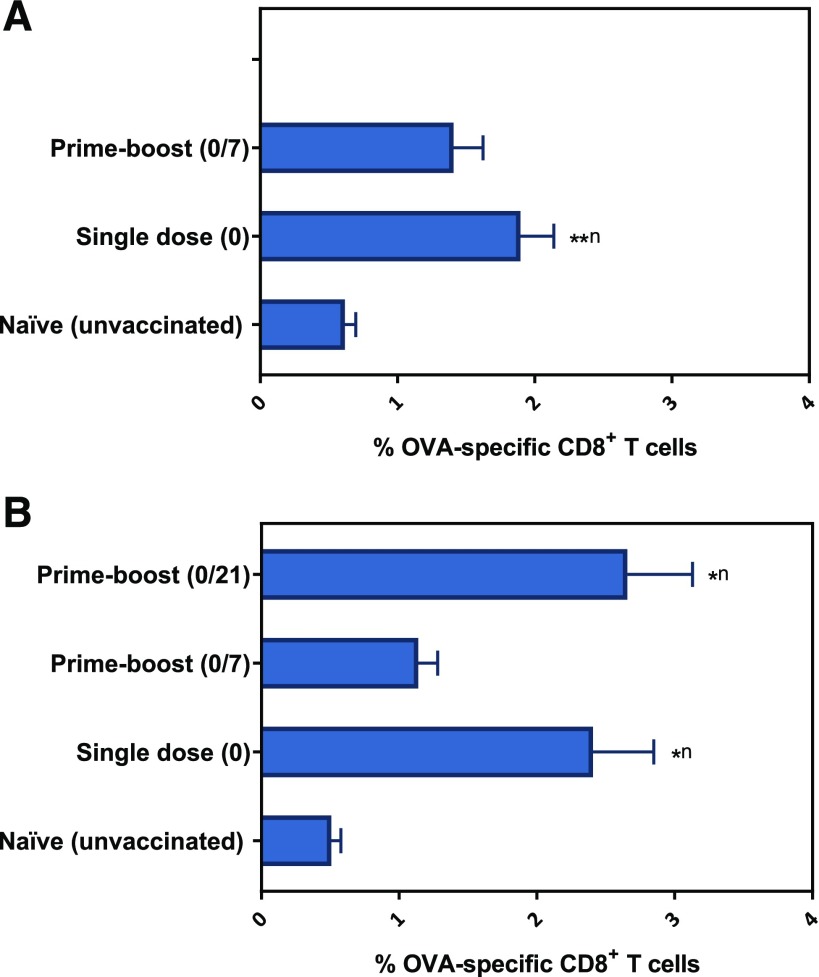
Fig. 4.1.
Percentage of OVA-specific CD8+ T cells in the peripheral blood of mice vaccinated with different polyanhydride-based vaccine regimens. The percentage of OVA-specific CD8+ T cells was measured at two-time points: (A) Two weeks (data from single-dose and prime-boost 0/21 groups were combined since mice in both groups received only one dose) and (B) 4 weeks post–prime vaccination. Data are plotted as mean ± S.E.M. *P < 0.05; **P < 0.01. Superscript n = compared with naïve group.


