Fig. 1.
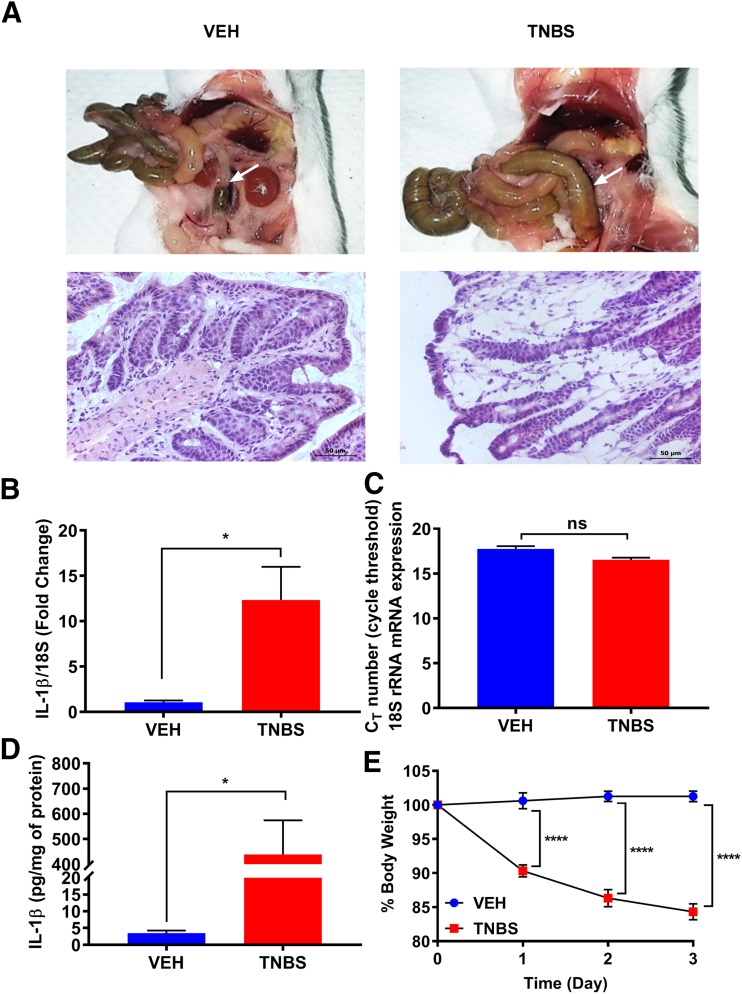
Evaluation of TNBS-induced colitis. (A) Mice treated with TNBS show a clear inflammation of colon, indicated by arrows, compared with vehicle-treated mice. H&E staining of colon sections demonstrates mucosal damage in TNBS treated mice. Scale bar, 50 µm. (B) TNBS treatment significantly increases mRNA expression of IL-1β from colon tissues on day 3. N = 6/group; *P = 0.0114 by unpaired t test. (C) Quantitative PCR data are normalized to housekeeping gene 18S rRNA, whose expression is not altered during an inflamed state; ns, not significant. (D) The level of IL-1β produced in TNBS-treated mice is significantly increased in colon tissues on day 3, correlating with the mRNA expression data. N = 5/group; *P = 0.0120 by unpaired t test. (E) Percentage of weight loss of TNBS-treated mice is significantly higher than the VEH group. N = 5/group; ****P < 0.0001 by two-way ANOVA with Tukey’s post hoc analysis.

