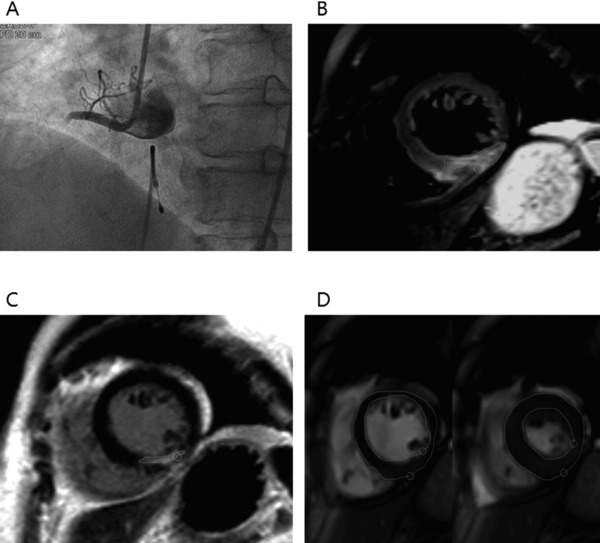
Figure 3.

An ST‐elevation myocardial infarction patient with a culprit lesion in the right coronary artery. Coronary angiogram showing total occlusion of the proximal right coronary artery (A). T2‐weighted short‐axis image showing edema in the inferior wall and inferoseptum of the left ventricle (B) and corresponding delayed enhancement (C). Myocardial mass and other functional parameters derived from stacked images measured by endocardial and epicardial contours at diastole (right image in D) and systole (left image in D).
