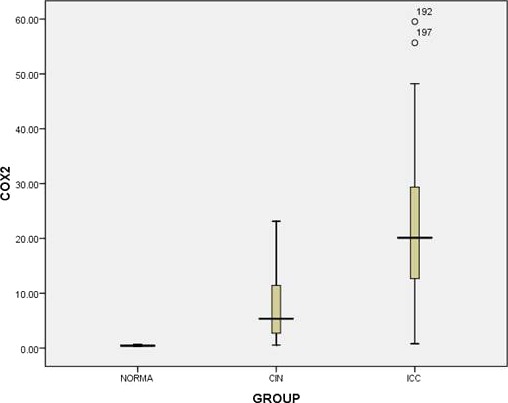
Figure 2.

Box plot analysis showing distribution of serum concentration (ng/ml) of Cox‐2 in normal, CIN, and SCCs patients. The vertical axis demonstrates the total Cox‐2 concentration and bold line indicates median score. Upper and lower limits of plot at 75th and 25th percentiles, respectively.
